Jacksonville is listed among 5 biggest U.S. “Boomtowns”, according to LendingTree

3 03 2023

Jacksonville is listed among 5 biggest U.S. "Boomtowns", according to LendingTree

Jacksonville is listed among 5 biggest “U.S. Boomtowns during pandemic,” according to LendingTree which ranked and scored the 100 largest metros in three main categories: people and housing, work and earnings and business and economy.

Southern metros dominated the list of the biggest boomtowns, with Florida, North Carolina, Texas and Virginia occupying eight of the Top 10 ranks.

Key findings

  • Southern metros dominate the list of the biggest boomtowns. Metros in Texas, Florida, North Carolina and Virginia occupy eight of the top 10 spots in the LendingTree boomtown rankings.
  • Among the 100 largest metros, Austin, Texas, has boomed the most during the pandemic. The number of housing units here jumped 12.9% between 2019 and 2021 — the second-highest among the 100 metros — and the population jumped by 5.6% in the same period — the third-highest — giving the central Texas metro the highest people and housing score.
  • We head west for the second-biggest boomtown: Provo, Utah. The north-central Utah metro outpaced Austin in our work and earnings category, led by its No. 1 growth in workforce size (8.4%). In other categories, Provo had the greatest population growth between 2019 and 2021 (7.2%) and the second-biggest jump in gross domestic product (13.2%) in the same period.
  • We head back South for our next-biggest boomtown: Lakeland, Fla. Lakeland had top-five finishes in individual metrics in all three categories: housing growth (7.7%), median earnings (16.3%) and new employer identification numbers (118.4%).
  • The most sluggish metro — despite being known for its wonderful beaches — is Honolulu. The Hawaii metro finished last in our work and earnings and business and economy categories with the biggest jump in the unemployment rate (119%), the third-smallest jump in median earnings (1.7%) and the third-biggest decrease in annual GDP (5.3%) between 2019 and 2021. Joining Honolulu at the bottom are Hartford, Conn., and Los Angeles.

Many of the biggest boomtowns are in the South

For the biggest boomtowns in the U.S., look to the South. Of the top 10, eight are in Texas, Florida, North Carolina and Virginia.

Top 10 biggest boomtowns

RankMetro
1Austin, TX
2Provo, UT
3Lakeland, FL
4Boise, ID
5Jacksonville, FL
6North Port, FL
7Durham, NC
8Raleigh, NC
9Charlotte, NC
10Virginia Beach, VA
Source: LendingTree analysis of various sources.

“People — especially work-from-home employees — are leaving for warm weather and lower taxes,” LendingTree chief credit analyst Matt Schulz says. “Especially for Florida and Texas, those two factors have been instrumental in driving a lot of the growth.”

If you have real estate questions or interested in buying or selling a home in Northeast Florida, please contact me at (904) 307-8998 or email williamvasana@kw.com. As a local area expert in Jacksonville Florida, I offer the highest level of professional services, luxury condo savvy, extensive residential experience, and intensive knowledge about Jacksonville neighborhoods and the overall market in the pre-construction and luxury development. I specialize in residential homescondominiumswaterfront properties and new construction homes in Duval, St. Johns and Clay counties.

William Vasana, Realtor


Investor Home Purchase Activity Fell By Nearly 50% In Q4

22 02 2023

Wall Street investor purchases of U.S. homes fell a record 45.8% year over year in the fourth quarter amid soaring interest rates as the high cost of borrowing money and the prospect of substantial home-price declines made real estate investing less attractive. The second biggest decline occurred in 2008, when investor purchases slumped 45.1% during the subprime mortgage crisis.

Overall U.S. home purchases fell 40.8% from a year earlier in the fourth quarter.

Investor purchases slumped 27% on a quarter-over-quarter basis, the largest quarterly decline on record aside from the beginning of the pandemic. That’s comparable with the 28.1% quarterly drop in overall home purchases.

While many investors have pumped the brakes on homebuying, investor market share has remained fairly steady. That’s because individual homebuyers have also pulled back. Investors purchased 17.8% of all homes that were bought in the metros tracked by Redfin in the fourth quarter. That’s comparable with 17.6% in the prior quarter and down from 19.4% a year earlier.

Investors bought $31 billion worth of homes in the fourth quarter, down 42.7% from $54.1 billion one year earlier and down 27.5% from $42.8 billion one quarter earlier. The typical home investors purchased cost $425,926, little changed from one year earlier but down 5.8% from one quarter earlier.

Investors piled into the housing market in 2021 due to rock-bottom mortgage rates and surging housing demand, and are now retreating amid projections that home prices have room to fall.

U.S. home prices are up less than 1% year over year—compared with 15% growth one year ago—and have fallen 11% from their spring 2022 peak. In many metros, prices are already declining on a year-over-year basis. That’s because the jump in mortgage rates last year dampened homebuyer demand. Higher rates also mean it’s more expensive to borrow money, which eats into profits. Many investors are moving their money into other asset classes that offer better returns. For investors who are landlords, slowing rent growth is also making it more challenging to reap large returns.

Investor home purchases in the fourth quarter of 2021 were near their record high, which is another reason the year-over-year decline in 2022 was so dramatic. Investors bought 48,445 homes in the metros tracked by Redfin in the fourth quarter of 2022, down from 89,396 a year earlier and 60,447 in the fourth quarter of 2019—before the pandemic.

Source: Redfin

If you have real estate questions or interested in buying or selling a home in Northeast Florida, please contact me at (904) 307-8998 or email williamvasana@kw.com. As a local area expert in Jacksonville Florida, I offer the highest level of professional services, luxury condo savvy, extensive residential experience, and intensive knowledge about Jacksonville neighborhoods and the overall market in the pre-construction and luxury development. I specialize in residential homescondominiumswaterfront properties and new construction homes in Duval, St. Johns and Clay counties.

William Vasana, Realtor


Northeast Florida Home Affordability Index falls nearly 35% in 2022

30 01 2023

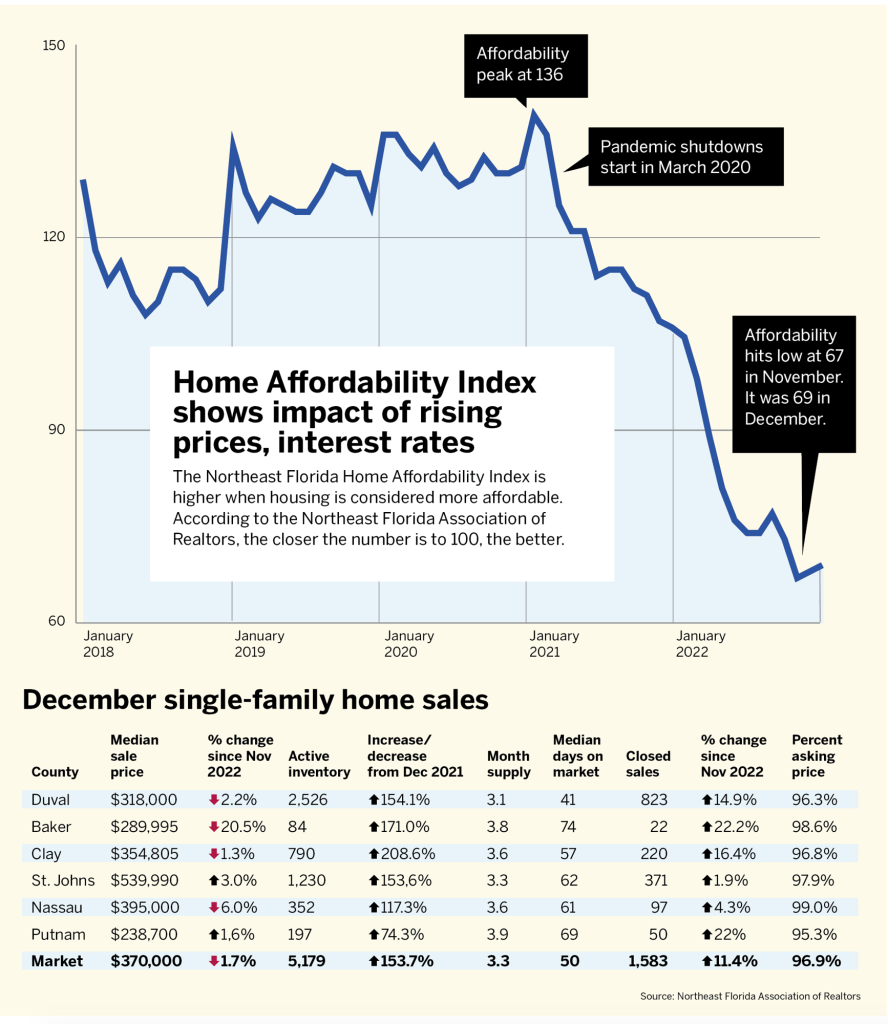
The Home Affordability Index for single-family homes in Northeast Florida fell steadily in 2022 from 104.5 in January to 69 in December. The index had dropped 34.9% in 12 months. The closer the index is to 100 or higher, the better.

The major factor in the lowering of the index throughout 2022 has been the dramatic increase in mortgage interest rates from around 3% to over 7% at the peak.

Home Affordability Index for single-family homes in Northeast Florida

Throughout the year, prospective buyers were priced out of the market.

The first half of the year showed increasing costs, low inventory and listings lasting little more than a week. 

The second half found median prices stabilizing, increased inventory and a greater number of choices for buyers.

The median price of a single-family home fell 1.7% in December to $370,000 from $376,385 in November.

The December 2022 median price was 5.7% higher than in December 2021.

Single-family home sales usually fall in December because of the holidays.

December 2022, however, was different from December 2021.

There were 1,583 closings, down 38.4% from 2,570 in December 2021.

Pending sales also showed a decline, with a 31.9% drop to 1,324 in December 2022 compared with 1,944 in December 2021.

The closed and pending unit sales in the combined single-family, condo and townhouse market in Northeast Florida has been relatively stable for the past 3-4 months with just slight movement month over month as we would expect in line with the seasonality of a ‘normal’ real estate market.

Days on market is now a median of 50 days, which is more typical for a balanced market while only a 3.2-month supply is still considered a ‘sellers’ market.

The number of new listings coming on the market is following the historic seasonality with fewer new listings during the holidays and an anticipation of an uptick in mid to late spring.

When condos and town home sales are added, the median price for the three home types combined was $345,00 in December, similar to the March 2022 median price of $350,000.

It peaked in July 2022 at a median of $375,000.

Bottom line: The housing market is normalizing and this is a good sign.

Source: Jacksonville Daily Record and Northeast Florida Association of Realtors

If you have real estate questions or interested in buying or selling a home in Northeast Florida, please contact me at (904) 307-8998 or email williamvasana@kw.com. As a local area expert in Jacksonville Florida, I offer the highest level of professional services, luxury condo savvy, extensive residential experience, and intensive knowledge about Jacksonville neighborhoods and the overall market in the pre-construction and luxury development. I specialize in residential homescondominiumswaterfront properties and new construction homes in Duval, St. Johns and Clay counties.

William Vasana, Realtor


Florida Home Sales Up 23.8% and Condo Up 17.7% in Dec.

24 01 2020

The holiday season was a time of good cheer for Florida’s housing market, with more closed sales, higher median prices and increased pending sales, plus more pending inventory in December 2019 compared to a year ago, according to the latest housing data released by Florida Realtors®.

Sales of single-family homes statewide totaled 25,557 last month, up 23.8% from December 2018.

Florida condo-townhouse sales were up 17.7% year-to-year. The statewide median price for single-family homes rose 5.9% to $270K, and condo-townhouse prices were up 8.1% to $200K. Pending inventory and new pending sales also rose statewide in both categories.

“Continued low interest rates are sparking buyer demand across Florida; however, a constrained supply and tight inventory of for-sale homes is putting pressure on home prices to rise,” says 2020 Florida Realtors President Barry Grooms, a Realtor and co-owner of Sarabay Suncoast Realty Inc. in Bradenton. “Existing single-family homes had a 3.4 months’ supply of inventory in December, while condo-townhouse properties showed a 5.2 months’ supply. In a positive sign, new pending sales rose 11.9% for single-family existing homes last month and new pending sales for condo-townhouse units increased 8.3%.

“Buying or selling a home can be a complex process, but a local Realtor stands ready to help.”

Statewide median sales prices for both single-family homes and condo-townhouse properties in December rose year-over-year for 96 months in a row. The statewide median sales price for single-family existing homes was $270,000, up 5.9% from the previous year, according to data from Florida Realtors Research Department in partnership with local Realtor boards/associations. Last month’s statewide median price for condo-townhouse units was $200,000, up 8.1% over the year-ago figure. The median is the midpoint; half the homes sold for more, half for less.

According to the National Association of Realtors® (NAR), the national median sales price for existing single-family homes in November 2019 was $274,000, up 5.4% from the previous year; the national median existing condo price was $248,200. In California, the statewide median sales price for single-family existing homes in November was $589,770; in Massachusetts, it was $405,000; in Maryland, it was $301,000; and in New York, it was $280,000.

Looking at Florida’s condo-townhouse market in December, statewide closed sales totaled 9,605, up 17.7% from the level a year ago. Closed sales may occur from 30- to 90-plus days after sales contracts are written.

Florida Realtors Chief Economist Dr. Brad O’Connor points out that Florida’s housing market this December showed very different data trends than the previous year. In December 2018, the state was experiencing weak existing home sales growth and rising inventory levels driven in part by higher interest rates, a troubled stock market and uneasiness generated by an impending shutdown of the federal government, according to O’Connor.

“Closed sales of existing single-family homes were up by nearly 24% compared to last December, while closings in the condo-townhouse category were up by almost 18%,” he says. “So why such a big jump? Well, part of it is explained by the fact that sales were unusually weak at the end of 2018, driven in part by a sharp increase in the average 30-year mortgage rate.

Of course, that doesn’t explain the entire increase in sales, he adds.

“The average 30-year mortgage rate spent the entire second half of 2019 in the range of 3.5% to 3.8%, flirting with historical lows,” O’Connor says. “And in the months since the mid-year yield curve scare that spooked the financial markets, the Federal Reserve has dropped the federal funds rate three times, restoring calm to the national economy. Here in Florida, we saw new pending sales for both property types begin surging in October, and now, with the December figures, we see a significant share of those deals successfully closed by year’s end.

According to Freddie Mac, the interest rate for a 30-year fixed-rate mortgage averaged 3.72% in December 2019, down from the 4.6% averaged during the same month a year earlier.

Source: Floridarealtors.org.


Housing sales, inventory trending up in Florida

4 12 2018

Florida’s housing market reported more closed sales, rising median prices and more new listings in October compared to a year ago, according to the latest housing data released by Florida Realtors®. Sales of single-family homes statewide totaled 22,272 last month, up 8.5 percent compared to October 2017.

October marked 82 consecutive months (more than six and a half years) that statewide median sales prices for both single-family homes and condo-townhouse properties increased year-over-year.

Rising interest rates are having a ripple effect across the housing market as the Federal Reserve increases borrowing costs. Analysts expect the Fed to raise rates again a few times in 2019. Areas with strong job or population growth, like Florida, may be able to weather higher mortgage rates, analysts say.

According to Freddie Mac, the interest rate for a 30-year fixed-rate mortgage averaged 4.83 percent in October 2018, up from the 3.90 percent averaged during the same month a year earlier.


U.S. Foreclosure Activity Drops to 10-Year Low in 2016

19 01 2017

U.S. foreclosure activity dropped 14 percent last year from 2015, according to Attom Data Solutions’ Year-End 2016 U.S. Foreclosure Market Report.

Foreclosure filings — default notices, scheduled auctions and bank repossessions — were reported on 933,045 U.S. properties in 2016, reaching the lowest level since 2006, when there were 717,522 U.S. properties with foreclosure filings.

Florida was ranked No. 4 in the nation due to having 1.18 percent of all the housing units in the state with foreclosure filings. The Sunshine State had 106, 901 total properties with foreclosure filings, down 33.09 percent from 2015, and down 77.97 percent from the peak in 2010.

In December, 85,919 U.S. properties had foreclosure filings, down 1 percent from the previous month and down 17 percent from a year ago — the 15th consecutive month with a year-over-year decrease in foreclosure activity.

“The national foreclosure rate stayed within an historically normal range for the third consecutive year in 2016, even as banks continued to clear out legacy foreclosures from the last housing bubble, particularly in the final quarter of the year,” said Daren Blomquist, senior vice president at Attom Data Solutions, the new parent company of RealtyTrac, in a prepared statement. “Foreclosures completed in the fourth quarter had been in the foreclosure process 803 days on average, a substantial jump from the third quarter and indicating that banks pushed through significant numbers of legacy foreclosures during the quarter. Despite that push, we still show that more than half of all active foreclosures nationwide are on loans originated between 2004 and 2008, with a much higher share of legacy foreclosures in some markets.”

When it comes to the number of legacy foreclosures, New Jersey led the way with 32,279, followed by New York (31,838), Florida (29,411), California (17,208), and Illinois (12,244).

In addition, the states with the highest foreclosure rates in 2016 were New Jersey (1.86 percent of housing units with a foreclosure filing); Delaware (1.51 percent); Maryland (1.37 percent); Florida (1.18 percent); and Illinois (1.10 percent).

Among 216 metropolitan statistical areas with a population of at least 200,000, those with the highest foreclosure rate in 2016 were Atlantic City, N.J., (3.39 percent of housing units with a foreclosure filing); Trenton, N.J., (2.16 percent); Rockford, Ill., (1.54 percent); Philadelphia (1.53 percent); and Lakeland-Winter Haven, (1.46 percent).

Other metro areas with foreclosure rates ranking among the top 10 highest nationwide in 2016 were Baltimore (1.45 percent of housing units with a foreclosure filing); Tampa-St. Petersburg (1.38 percent); Chicago (1.35 percent); Columbia, S.C., (1.32 percent); and Miami (1.30 percent).

There were eight states where the average time to foreclose in the fourth quarter was more than 1,000 days: Utah (1,403); New Jersey (1,383); New York (1,283); Hawaii (1,220); Florida (1,186); Indiana (1,033); Illinois (1,024); and Pennsylvania (1,010).

Attom’s year-end foreclosure report is a count of unique properties with a foreclosure filing during the year based on publicly recorded and published foreclosure filings collected in more than 2,500 counties nationwide, with address-level data on more than 23 million foreclosure filings historically also available for license or customized reporting.

Source: Florida Realtors®, Orlando Business Journal, RealtyTrac


Pending Home Sales Hit a 10-Year High in April

28 05 2016

Pending home sales rose for the third consecutive month in April and reached their highest level in over a decade, according to the National Association of Realtors® (NAR).

All major regions saw gains in contract activity last month except for the Midwest, which saw a meager decline.

The Pending Home Sales Index – a forward-looking indicator based on contract signings for homes that have not yet sold – hiked 5.1 percent higher to 116.3 in April from an upwardly revised 110.7 in March. Year-to-year, it’s 4.6 percent above April 2015 (111.2).

After last month’s gain, the index has now increased year-over-year for 20 consecutive months. Vast gains in the South and West propelled April’s pending sales in April to its highest level since February 2006 (117.4), says Lawrence Yun, NAR chief economist.

“The ability to sign a contract on a home is slightly exceeding expectations this spring, even with the affordability stresses and inventory squeezes affecting buyers in a number of markets,” Yun says. “The building momentum from the over 14 million jobs created since 2010 and the prospect of facing higher rents and mortgage rates down the road appear to be bringing more interested buyers into the market.”

Mortgage rates have remained below 4 percent in 16 of the past 17 months, but Yun says it remains to be seen how long they will stay this low. Along with rent growth, rising gas prices – and the fading effects of last year’s cheap oil on consumer prices – could edge up inflation and push rates higher. For now, Yun foresees mortgage rates continuing to hover around 4 percent in coming months, but inflation could potentially surprise the market and cause rates to increase suddenly.

“Even if rates rise soon, sales have legs for further expansion this summer if housing supply increases enough to give buyers an adequate number of affordable choices during their search,” adds. Yun.

Following the housing market’s best first quarter of existing-sales since 2007 (5.66 million) and a decent increase (1.7 percent) in April, Yun expects sales this year to climb above earlier estimates and be around 5.41 million – a 3.0 percent boost from 2015. After accelerating to 6.8 percent a year ago, national median existing-home price growth is forecast to slightly moderate to between 4 and 5 percent.

Pending sales in the Northeast climbed 1.2 percent to 98.2 in April, and are now 10.1 percent above a year ago. In the Midwest, the index declined slightly (0.6 percent) to 112.9 in April, but it’s still 2.0 percent above April 2015.

Pending home sales in the South jumped 6.8 percent to an index of 133.9 in April – 5.1 percent higher than last April. The index in the West soared 11.4 percent in April to 106.2, and it’s now 2.8 percent above a year ago.

Source: National Association of Realtors


June Home Starts Surge – Highest Pace in 28 Years

18 07 2015

The U.S. Commerce Department announced that housing starts in June climbed 9.8 percent to a seasonally adjusted annual rate of 1.17 million homes. All of that growth came from a 28.6 percent surge in multi-family housing that put apartment construction at its highest rate since November 1987. Starts for single-family houses slipped 0.9 percent last month.

U.S. builders broke ground on apartment complexes in June at the fastest pace in nearly 28 years, as developers anticipate that recent job gains will launch a wave of renters.

The gains show that what had been a sluggish construction sector is now running on economic adrenaline. Strong job growth and a rebounding economy have increased the numbers of buyers and renters searching for homes, while gradually rising mortgage rates have spurred homeowners to finalize deals.

Housing starts jumped 35.3 percent in the Northeast because of apartments, while climbing 13.5 percent in the South. Home construction slumped in the Midwest and West in June.

Nationwide, housing starts have risen 10.9 percent year-to-date.

Over the past 12 months, employers have added 2.9 million jobs, meaning there are more people with paychecks to spend across the broader economy. The impact of those job gains and the unemployment rate drop to 5.3 percent has surfaced in housing, where demand is outpacing the supply of homes and creating more pressure to build houses and apartments.

The market for new homes for sale had just 4.5 months of supply in May, compared to 6 months in a healthy market.

Approved building permits increased 7.4 percent to an annual rate of 1.34 million in June, the highest level since July 2007. The bulk of that increase came for apartment complexes, while permits for houses last month rose just 0.9 percent.

There are other signs that builders are increasingly optimistic.

The National Association of Home Builders/Wells Fargo builder sentiment index released Thursday climbed to 60 this month, a level last reached in November 2005 – shortly before the housing boom gave way to the mortgage crisis that triggered the Great Recession. Readings above 50 indicate more builders view sales conditions as good rather than poor.

Mortgage rates have started to rise, although they remain low by historic standards.

Source: The Associated Press


U.S. New-Home Sales in May Climb to Best Levels Since 2008

24 06 2015

Purchases of new U.S. homes surged in the Northeast and West in May, as steady job growth over the past year has lifted the real estate sector.

The Commerce Department said that new-home sales rose 2.2 percent in May 2015 to a seasonally adjusted annual rate of 546,000, the strongest pace in more than seven years.

Sales of new homes have soared 24 percent year-to-date, helped by the additional incomes from the employers hiring 3.1 million workers in the past 12 months and relatively low mortgage rates. The sharp increase in purchases could help drive more employment in the construction sector and broader economic growth, potentially offsetting the setbacks to growth in the manufacturing sector caused by cheaper oil prices and a stronger dollar that has hurt exports.

Last month’s sales gains were concentrated in the Northeast, where sales jumped 87.5 percent. New-home sales increased 13.1 percent in the West, but slipped in the Midwest and South.

The median sales price has fallen slightly, dipping 1 percent over the past 12 months to $282,800.

The increases have caused the supply of new homes to dwindle to 4.5 months, compared to the six months’ supply generally associated with a healthy market.

Still, homebuilders are preparing to meet this demand, having broken ground on more houses this year and plan to continue construction. Approved building permits rose increased 11.8 percent to an annual rate of 1.28 million, the highest level since August 2007, the Commerce Department reported last week.

Existing homes are also seeing strong sales as the economy continues to muscle up.

Sales of existing homes climbed 5.1 percent in May to a seasonally adjusted annual rate of 5.35 million, the National Association of Realtors said Monday. Tight supplies have lifted prices, which have climbed 7.9 percent over the past 12 months to an average of $228,700, about $1,700 below the July 2006 peak.

Much of the increased buying activity flows from a stronger job market and relatively affordable mortgage rates.

Borrowing costs are low by historical standards, but they have been rising in recent weeks at a speed that might prompt more people to buy homes.

Average 30-year fixed rates were 4 percent last week, according to the mortgage giant Freddie Mac. That average has increased from a 52-week low of 3.59 percent.

Soure: Associated Press


U.S. existing home sales rise in December but down for 2014

24 01 2015

U.S. home resales rose slightly in December but fell overall for the year, the first annual drop since 2010 and another sign that the housing market recovery remains uneven amid expectations of a pick-up in 2015.

The National Association of Realtors said existing home sales increased 2.4 percent to an annual rate of 5.04 million units last month. That was slightly below economists’ expectations for a 5.06-million-unit pace.

“The still-tight mortgage credit conditions and more challenging first-time homebuyer affordability that were revealed by the failure of home sales to continue recovering last year remain serious concerns as we head into 2015,” said Ted Wieseman, an economist at JPMorgan in New York.

First-time buyers made up 29 percent of transactions in December as well as for the year as a whole, well below the level needed to boost growth in the housing market.

For all of 2014, existing home sales fell 3.1 percent, the first annual drop in four years. The housing market has struggled to maintain momentum since stagnating in the second half of 2013 following a run-up in mortgage rates.

At December’s sales pace it would take 4.4 months to clear all available houses from the market, down from 5.1 months in November and the lowest since January 2013.

However, a decline in mortgage rates, an easing of lending standards and the resurgent health of the U.S. economy over the last few months has spurred optimism that sales could strengthen this year.

And the outlook for the economy remains upbeat. In a separate report the Conference Board said its Leading Economic Index rose 0.5 percent last month after a 0.4 percent increase in November.

December’s jump was driven by gains in most of the index’s components, suggesting the short-term outlook is getting brighter and the economy continues to build momentum, the Conference Board said.

Source: Reuter


Delinquent Homeowners Two Years Behind on Mortgage Payment Can Now Qualify For Loan Modification

21 10 2014

Florida borrowers two or more years late on their mortgage payments could get another chance to save their homes following a change in loan modification rules by the Federal Housing Finance Agency.

Federal mortgage backers Fannie Mae and Freddie Mac announced the elimination of an eligibility cap that forbid loan modifications to people with delinquencies of 720 days or more.

The change was made to the “streamlined modification” program, which was created in 2013 and billed as a more automatic route to lower mortgage payments because no application or exchange of paperwork is required.

It’s estimated that nearly half of borrowers nationwide who are ineligible because of the 720-day cap, would otherwise be able to get a loan modification through the program, according to the Federal Housing Finance Agency.

Lenders must comply with the cap elimination by April 1, 2015, but are being encouraged to make the change immediately. Borrowers who were previously denied a streamlined modification because they were more than two years late on payments must be reevaluated, according to letters sent to lenders and mortgage servicers Oct. 1.

“We’ve had multiple clients receive approvals under this program,” said Paul Baltrun, director of corporate development for the Law Office of Paul A. Krasker in West Palm Beach. “It’s very little paperwork, mostly just phone conversations with the lender, and the turn time is quicker.”

The streamlined modification program was developed because of consistent complaints from borrowers that banks repeatedly lose loan modification paperwork in a bureaucratic process that can take years to complete. Banks have also said obtaining the correct employment and payment documents from borrowers can be a hurdle in completing a modification.

Under the program, lenders send contracts to borrowers with new payment amounts. The modification could include a fixed interest rate, an extension of the loan to 40 years, and possibly deferring a portion of the debt owed to the end of the loan so it’s not included in current payment calculations.

Also, borrowers are encouraged to apply for other loan modification plans, such as the Home Affordable Modification Program, which could offer a better deal.

If the borrower agrees and makes three on-time payments, the modification becomes permanent.

Baltrun said it’s hard to gauge how many people the change will affect. Although the worst of the foreclosure crisis is over, he said a significant number of homeowners are still looking for modifications because they have lost jobs, or have used up their savings trying to stay in their home.

“I think it will help a small number of people in specific circumstances,” said Baltrun, who believes removing the cap is a good change. “Why would someone who is 721 days late be declined when someone who is 719 days late is approved?

Other eligibility requirements for the streamlined modification include homeowners must be at least 90 days late on their mortgage and can’t have more than 20 percent equity in their home.

About 3 percent of Florida homeowners with mortgages were 90 days late or more on payments during the second quarter of this year, according to the Mortgage Bankers Association. Nearly 10 percent were either 90 days delinquent, or in foreclosure.

While that’s still the second highest foreclosure and serious delinquency rate in the nation behind New Jersey, it’s an improvement from where Florida was at the end of 2011 when 18 percent of mortgages were in the same position.

Streamlining modifications is increasingly important in Florida where foreclosure courts are moving cases more quickly through the system. That means less time for negotiating with the bank before a final foreclosure judgment is issued.

“You can’t even keep people in their homes very long anymore,” said Deerfield Beach-based attorney Bonnie Lynn Canty, who defends foreclosures. “Used to be four years out before you were looking at a (foreclosure) sale date. Now, it’s at the most two years.”

Source: Palm Beach Post, Bloomberg BusinessWeek


Florida Tops in the U.S. for Cash Sales of Homes in July

16 10 2014

Florida had the largest share of cash sales of any state in July, with 49.7 percent, a new report from CoreLogic shows.

For the United States as a whole, cash sales made up 32.9 percent of total home sales in July, the lowest share since August 2008 and down from 35.9 percent in July 2013.

Besides Florida, other states with the largest percentage of cash sales included Alabama (47.6 percent), New York (44.5 percent), West Virginia (42 percent) and Idaho (39.9 percent).

Of the largest 100 core based statistical areas measured by population, West Palm Beach-Boca Raton-Delray Beach had the highest share of cash sales at 57.9 percent, followed by Cape Coral-Fort Myers (57.3 percent), Miami-Miami Beach-Kendall (56.5 percent), North Port-Sarasota-Bradenton (55.8 percent) and Detroit-Dearborn-Livonia, Mich. (55.8 percent).

Washington-Arlington-Alexandria, D.C.-Va.-Md. had the lowest cash sales share at 15.4 percent.

Source: Jacksonville Business Journal.


Ponte Vedra Dominates Priciest Home Sales in Second Quarter

13 10 2014

The second quarter of 2014 saw a number of multi-million dollar home sales in the Jacksonville area, with the majority of them in Ponte Vedra Beach.

The top sale of the quarter was a 4,200-square-foot home in the 800 block of Ponte Vedra Beach Boulevard, and nine more of the top 20 sales were nearby

Together, the 20 homes sold for just over $49 million, with the average price of the list around $2.5 million.

As well as Ponte Vedra Beach, the other waterfront areas of the region — not surprisingly — helped fill out the list, with Jacksonville Beach, Atlantic Beach and Fernandina Beach all snagging spots. Jacksonville proper had three homes on the list.

Source: Jacksonville Business Journal


Augst Home Prices Up 6.4 Percent Over Last Year

8 10 2014

Home prices continued the annual gains in August but have appreciated at a slower pace since hitting a peak a year ago.

CoreLogic, which tracks data on the housing market, reported that prices rose 6.4 percent in August compared with the same month a year ago, representing 30 months of year-over-year increases.

Home prices hit a high of 12 percent year-over-year in October 2013 and has been dropping since then.

“Continued moderation of home price appreciation is a welcomed sign of more balanced real estate markets and less pressure on affordability for potential home buyers in the near future,” Fleming said.

Prices were up 0.3 percent in August over July.

At the state level, including distressed sales, all states showed year-over-year home price appreciation in August.

Prices reached new highs in nine states — Alaska, Colorado, Iowa, Louisiana, Nebraska, North Dakota, Oklahoma, Texas and Wyoming — plus the District of Columbia.

Excluding distressed sales, home prices nationally increased 5.9 percent in August compared with the same month a year ago and 0.3 percent on a monthly basis.

Also, taking out distressed sales, 49 states and the District of Columbia showed year-over-year home price appreciation in August, with Mississippi being the only state to experience a decline (-1.7 percent).

CoreLogic’s forecast shows that home prices, including distressed sales, will increase 0.2 percent from August to September and by 5.2 percent from August to August 2015.

“Home prices continue to rise, albeit more slowly, across most of the U.S.,” said Anand Nallathambi, president and CEO of CoreLogic.

“Major metropolitan areas such as Riverside and Los Angeles, California, and Houston continue to lead the way with strong price gains buoyed by tight supplies and a gradual rebound in economic activity.”

Source: CoreLogic


U.S. Existing Home Sales Dip in August

30 09 2014

U.S. existing home sales retreated 1.8 percent to a 5.05 million annual pace in August.

Pending home sales dropped in August for the same reason closings did— investors retreated from the housing market

The National Association of Realtors’ Pending Home Sales Index, which is based on contract signings, fell 1 percent last month to 104.7. That number still represents an above-average level of contract activity.

But traditional home buyers who rely on mortgages will have to carry the housing market going forward — investors who pay cash aren’t buying as many homes as they were.

“Fewer distressed homes at bargain prices and the acknowledgement we’re entering a rising interest rate environment likely caused hesitation among investors last month,” said NAR Chief Economist Lawrence Yun.

The question is whether first-time buyers will become bigger players in the housing market. They’ve represented less than one-third of home purchasers over the past two years.

Yun thinks their share will go up gradually.

“The employment outlook for young adults is brightening and their incomes finally appear to be rising,” he said. “Jobs and income gains will help repay student debt and better position first-time buyers, setting the stage for improved sales growth in upcoming years.”

Yun projects existing home sales will total 4.94 million this year, down 3 percent from 2013.

The South remains the hottest market, with a Pending Home Sales Index of 117. The Northeast is the coolest, with an index of 86.5.

Source: Nightly Business Report and Bloomberg


Jacksonville Home Sales and Prices Decline, But Pending Sales at Nine-Year High

15 09 2014

Fewer homes were sold in Northeast Florida in August than in the month before. And they sold for less money, too. Median sales prices dropped in August 2014, both from July and from August 2013, according to the Northeast Florida Association of Realtors.

There were only a few pieces of good news in the report. Even though sales were down, there more pending sales (contracts signed, but not closed) than any month since mid-2005.

The number of lender-mediated homes (foreclosures, short sales or lender-owned) continues to drop. At one point a few years ago, close to 60 percent of all listings were lender-mediated. That dropped to 34.9 percent in August 2013 to 23.5 percent last month.

The key numbers:

■ Median sales price – $158,500, down from $165,250 in July and $169,900 in August 2013.

■ Average sales price – $199,930, down from $216,305 in July, up from $198,360 in August 2013.

■ Pending sales – 2,305, up from 2,266 in July and 1,901 in August 2013.

■ Closed sales – 1,996, down from 2,196 in July and 2,045 in August 2013.

■ Average days on the market until sale – 82, down from 83 in July, up from 79 in August 2013.

■ Number of houses for sale – 9,758, down from 10,448 in July and 10,576 in August 2013.

Here’s the number of homes sold and media price sold in area of Northeast Florida. The first two figures are for August, the second two are for August 2013:

Area Sold Median price


NE St. Johns County – 19, $433,693; 12, $283,500

Neptune Beach – 9, $348,000; 10, $367,700

Ponte Vedra/Vilano/Palm Valley/Nocatee – 104, $340,051; 115, $328,750

Jacksonville Beach – 42, $295,000; 56, $275,500

NW St. Johns County – 205, $260,000; 222, $256,500

St. Augustine east of U.S. – 11, $239,500; 10, $154,500

Fleming Island – 58, $238,000; 56, $230,000

Atlantic Beach – 41, $211,000; 27, $310,000

Riverside/Ortega/Avondale – 25, $207,500; 51, $192,500

Ponte Vedra Beach North – 8, $184,500; 19, $230,000

Nassau County – 60, $183,510; 52, $177,000

Southside/Mandarin – 198, $182,500; 233, $180,000

SE St. Johns County – 77, $175,000; 65, $216,000

Jacksonville North – 90, $169,750; 92, !59,990

Middleburg – 60, $149,950; 42, $134,700

Green Cove Springs – 12, $149,500; 15, $116,500

Orange Park – 132, $142,000; 128, $136,900

Southside – 278, $136,775; 263, $168,000

Baker County – 24, $121,000; 16, $143,500

Marietta/Whitehouse/Baldwin/Dinsmore – 28, $119,750; 19, $78,000

Arlington/Fort Caroline – 149, $113,000; 160, $131,400

West Jacksonville- 94, $111,500; 119, $100,000

SW St. Johns County – 8, $102,000; 7, $192,481

Keystone Heights – 11, $87,000; 14, $79,500

Hyde Grove/Murray Hill/ Lakeshore/Wesconnett – 81, $60,000; 78, $47,500

West Putnam County – 18, $51,750; 13, $45,000

South Putnam County – 15, $44,000; 14, $41,250

NE Putnam County – 28, $39,950; 34, $68,100

Springfield/Downtown/Paxon /Trout River – 73, $21,000; 69, $23,150


Source: Florida Times Union and Northeast Florida Association of Realtors.


Jacksonville Housing Market Report – August 2014

12 09 2014

The Northeast Florida Association of Realtors published the 2014 August real estate report with in-depth summary of  Jacksonville housing real estate market including 29 submarket areas.

In retrospect, pent-up demand continues to push Jacksonville home prices up. Low housing inventory, sustained job growth, lower mortgage rates and a slow rise in the number of homes for sale in Northeast Florida helped boost the home sales and median prices in the second quarter.

New Listings in the Northeast Florida region decreased 6.9 percent to 2,759. Pending Sales were up 21.3 percent to 2,305. Inventory levels fell 7.7 percent to 9,758 units. The Median Sales Price decreased 6.7 percent to $158,500. Days on Market was up 5.1 percent to 83 days. Sellers were encouraged as Months Supply of Inventory was down 16.9 percent to 4.9 months. This indicates the seller’s market.

See full report here.

2014 August Jacksonville Housing Market Report

2014 August Jacksonville Housing Market Report


The Energy Hua Hin oceanfront condo in Thailand

10 08 2014

The Energy Hua Hin CondoNew oceanfront condo project in Hua Hin, Thailand priced from the USD $50K. Project is under way and Phase 1 and 2 are expected to complete in 2015. The Energy will endlessly recharge and revitalize residents through the natural beauty of Hua Hin Beach in a town with intriguing historical sties and access to every convenience of modern life. The Energy is a home where everyday is a holiday.

Every building at The Energy Hua Hin has been meticulously designed to blend Colonial architecture with modern functionality. The project offers a new way of living by catering to urban dwellers in an ambience that charmingly evokes another era gone by.

The Energy Hua Hin condos comprise eight-story low-rise buildings angled to catch cool sea breezes while providing great privacy. Each unit is ready to move in, being fully furnishes in a vintage style with all the comforts required by modern urban dwellers. Amenities include a 5-star hotel reserved for residents’ guests only, 10,000 square-meter (approx. 100,000 S.F.) sports complex with Thailand’s first virtual reality game dome, infinity edge swimming pool, squash, bowling, tennis, badminton, pool table, table tennis, sauna, jogging, and more.

Hua Hin is among Bangkok residents’ favorite destinations for a relaxing weekend, being just a two-hour drive from the capital city. The small town, with its distinct style that combines classical and contemporary architectural designs, exudes a timeless charm and an aura of happiness that repeatedly draws visitor back.

Message me for more info.


New Home Sales Increased 6.4% in April

23 05 2014

Sales of new homes increased by 6.4 percent in April to a seasonally adjusted rate of 433,000, according to the U.S. Census Bureau.

Sales of existing homes also increased last month, but only by 1.3 percent, according to the National Association of Realtors.

Put the two reports together, and it’s an encouraging sign that housing has shaken off its winter-induced doldrums. But sales of both new homes and existing homes were below what they were in April 2013.

Lawrence Young, chief economist for the National Association of Realtors, expects total home sales for 2014 as a whole will be below what they were in 2013, primarily because of the “sluggish first quarter.”

The average price for a new house sold last month was $275,800, according to Census Bureau.

The median price for an existing home in April was $201,700, according to NAR.

Mortgage rates are trending down, but they’re still higher than were a year ago. The average 30-year fixed-rate mortgage was 4.14 percent with an average 0.6 point this week, according to Freddie Mac. A year ago, the rate averaged 3.59 percent.

Source: Jacksonville Business Journal


Residential Real Estate Price Growth is Strongest Since 2005

4 02 2014

Home prices — both nationwide and in Jacksonville — are on the rise, according to a report from CoreLogic.

Across the United States, home prices have increased 11 percent from December 2012 to December 2013, including distressed sales.

The CoreLogic Home Price Index report on Tuesday reported the 22nd consecutive monthly year-over-year increase in US home prices based on Multiple Listing Service data.

In Jacksonville, home prices increased 9 percent including distressed sales and 11.5 percent when distressed sales are excluded, on a year-over-year basis.

Sales jumped 1.5 percent from November to December.

The CoreLogic report follows a report from RealtyShack showing an increase in home flipping.

See the full CoreLogic report here.

Source: CoreLogic and Jacksonville Business Journal