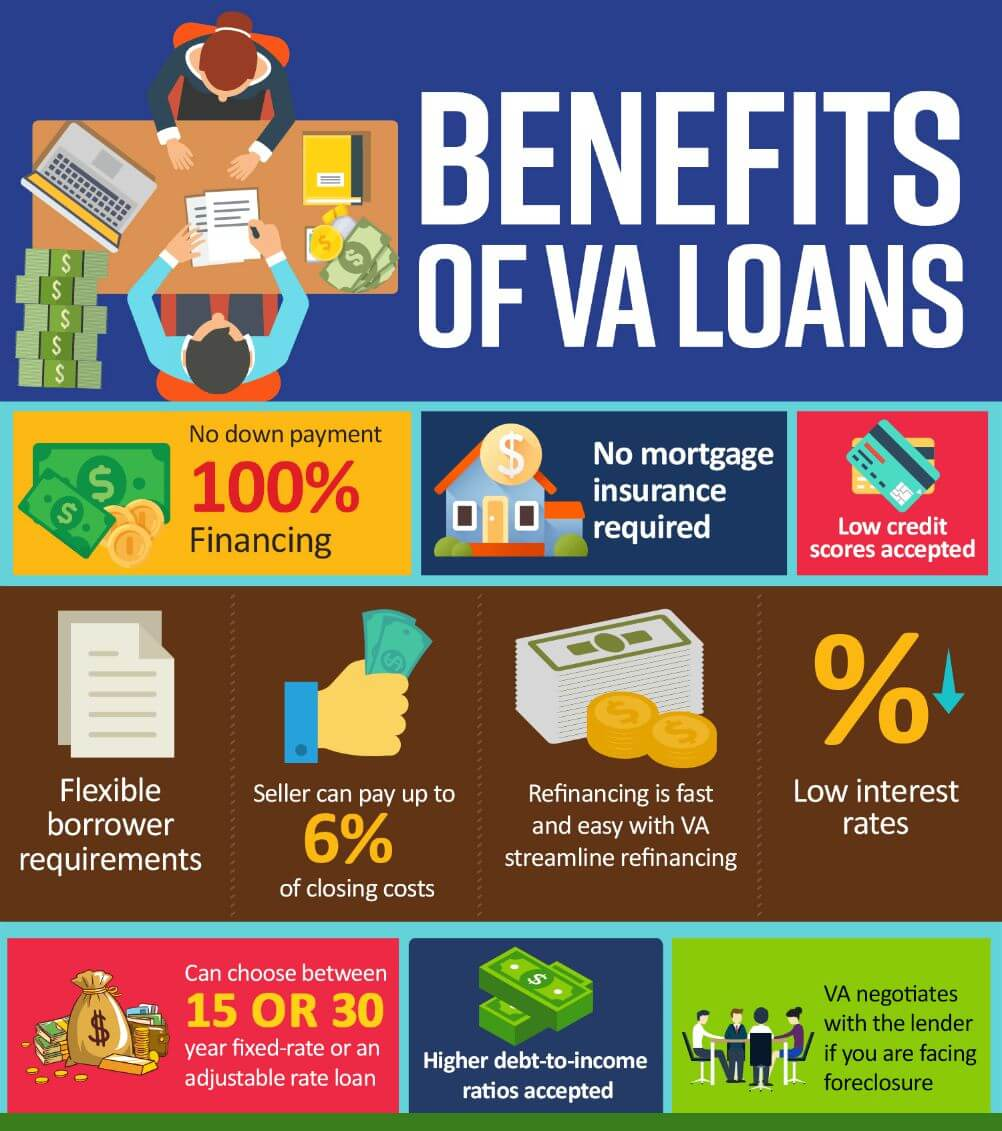
Are you or someone you know considering a VA loan for a new home? Here’s some valuable information that can help you navigate the process more smoothly and save money at the closing table.
One of the significant advantages of VA loans is that they require no down payment for qualified VA borrowers. But that’s not all! When it comes to closing costs, there’s a distinct advantage for veterans as well. Here’s a breakdown of how it works:
Types of Closing Costs VA borrowers are limited in terms of which closing costs they can pay for, and a handy acronym to remember these allowable costs is ACTORS:
A – Appraisal C – Credit Report T – Title Insurance O – Origination Fee R – Recording Fee S – Survey
These are the charges most commonly found on VA mortgages and can be paid for by the veteran. However, there are other charges like attorney fees, underwriting fees, escrow, processing fees, document fees, and tax service fees that veterans are not allowed to pay.
Who Pays for Non-Allowed Costs?
The Seller Can: The seller of the property can agree to pay non-allowed closing costs as part of the sales contract, commonly known as a seller concession. This is typically limited to four percent of the home’s sales price.
The Lender Can: Lenders can offer a credit to the borrower by adjusting the interest rate. This can help offset some or all of the closing costs.
The Borrower Can: Instead of non-allowed fees, the lender may charge a one percent origination fee, which is an allowable charge for VA loans.
The Agent Can: In some cases, the real estate agent representing the buyer can contribute towards closing costs. This contribution comes from the commissions paid by the seller.
It’s important to note that VA loan closing costs differ from FHA or conventional loans, and understanding who is responsible for specific fees can be confusing. If you have any questions or need clarification, don’t hesitate to reach out to your loan officer. We’re here to help you make the best financial decisions for your home purchase journey!
Ready to take the next step? Give me a call today to get started on your path to homeownership with a VA loan. Your dream home is within reach!
Jacksonville is listed among 5 biggest “U.S. Boomtowns during pandemic,” according to LendingTree which ranked and scored the 100 largest metros in three main categories: people and housing, work and earnings and business and economy.
Southern metros dominated the list of the biggest boomtowns, with Florida, North Carolina, Texas and Virginia occupying eight of the Top 10 ranks.
Key findings
Southern metros dominate the list of the biggest boomtowns. Metros in Texas, Florida, North Carolina and Virginia occupy eight of the top 10 spots in the LendingTree boomtown rankings.
Among the 100 largest metros, Austin, Texas, has boomed the most during the pandemic. The number of housing units here jumped 12.9% between 2019 and 2021 — the second-highest among the 100 metros — and the population jumped by 5.6% in the same period — the third-highest — giving the central Texas metro the highest people and housing score.
We head west for the second-biggest boomtown: Provo, Utah. The north-central Utah metro outpaced Austin in our work and earnings category, led by its No. 1 growth in workforce size (8.4%). In other categories, Provo had the greatest population growth between 2019 and 2021 (7.2%) and the second-biggest jump in gross domestic product (13.2%) in the same period.
We head back South for our next-biggest boomtown: Lakeland, Fla. Lakeland had top-five finishes in individual metrics in all three categories: housing growth (7.7%), median earnings (16.3%) and new employer identification numbers (118.4%).
The most sluggish metro — despite being known for its wonderful beaches — is Honolulu. The Hawaii metro finished last in our work and earnings and business and economy categories with the biggest jump in the unemployment rate (119%), the third-smallest jump in median earnings (1.7%) and the third-biggest decrease in annual GDP (5.3%) between 2019 and 2021. Joining Honolulu at the bottom are Hartford, Conn., and Los Angeles.
Many of the biggest boomtowns are in the South
For the biggest boomtowns in the U.S., look to the South. Of the top 10, eight are in Texas, Florida, North Carolina and Virginia.
Top 10 biggest boomtowns
Rank
Metro
1
Austin, TX
2
Provo, UT
3
Lakeland, FL
4
Boise, ID
5
Jacksonville, FL
6
North Port, FL
7
Durham, NC
8
Raleigh, NC
9
Charlotte, NC
10
Virginia Beach, VA
Source: LendingTree analysis of various sources.
“People — especially work-from-home employees — are leaving for warm weather and lower taxes,” LendingTree chief credit analyst Matt Schulz says. “Especially for Florida and Texas, those two factors have been instrumental in driving a lot of the growth.”
Starting on March 1st, all eligible military members will be automatically enrolled for $500,000 worth of Servicemembers’ Group Life Insurance coverage — even if they previously chose not to buy it — unless they opt out. The increase from the previous maximum of $400,000 was mandated by a law passed on October 17, 2022. The “Supporting Families of the Fallen Act” specifies that the increase to $500,000 in coverage can’t result in the insurance programs operating at a loss.
The insurance is administered by the Department of Veterans Affairs (VA) and pays beneficiaries in the event of the member’s death while on active duty or serving in the National Guard or Reserve.
Military members have until March 31st to opt out or reduce their coverage if they choose.
The new maximum coverage comes with a monthly premium of $31, up from $24 for the previous maximum. Members may also choose to purchase less coverage in $50,000 increments for lower premiums. TSGLI coverage, which pays out in the event of a traumatic injury, will also be included with an additional $1 monthly deduction. There is also $10,000 in free life insurance coverage for each dependent child.
During March, eligible troops need to decide whether to:
Do nothing and accept the maximum coverage.
Reduce their coverage. TSGLI and dependent child coverage remain in place all the way down to the coverage minimum of $50,000.
Change their beneficiaries.
Decline the coverage entirely. This will also cancel the TSGLI and dependent child coverage.
Those eligible for SGLI include service members on active duty; cadets and midshipmen at the military academies; certain Reserve Officer Training Corps cadets and midshipmen; drilling Guard or Reserve members; and Individual Ready Reserve members in a mobilization category. Commissioned members of the National Oceanic and Atmospheric Administration and the U.S. Public Health Service also qualify.
Rising costs of living spurred the increase in the maximum benefit, last raised from $250,000 to $400,000 in 2005, according to the VA’s frequently asked questions addressing the change. The department said it’s enrolling everyone automatically so that all can benefit “without any medical underwriting” — in other words, without taking your health into account.
Some more particulars surrounding the change:
Existing SGLI coverage of a spouse under Family SGLI won’t change unless the service member declines SGLI in March, in which case the family coverage ends the first day of the month after declining.
The increase will not be available retroactively.
The SGLI paycheck deduction for March will either be the same as the service member was already paying; or $25, which was the prior maximum plus TSGLI. In case of a claim — if you die in March and your beneficiaries are due the payout — the difference will be deducted to get up to the month’s full premium.
Service members who reduce or decline the coverage and later want to increase it will have to answer medical questions.
The increase will not be available retroactively, and if a service member declines SGLI coverage in March, their Family SGLI coverage for their spouse will end on the first day of the following month. Those who reduce or decline coverage and later want to increase it will have to answer medical questions. The VA also debuted a new life insurance program for veterans on January 1st and will now be providing $1.45 trillion of life insurance coverage, making it the 12th largest group life insurer in the United States. The VA administers both the SGLI and VGLI insurance programs.
Service members leaving the military on or after March 1 who had the maximum SGLI coverage can purchase VGLI coverage up to $500,000. Veterans under age 60 who currently have $400,000 maximum VGLI coverage will be able to purchase additional coverage, in increments of $25,000, at specified anniversary dates.
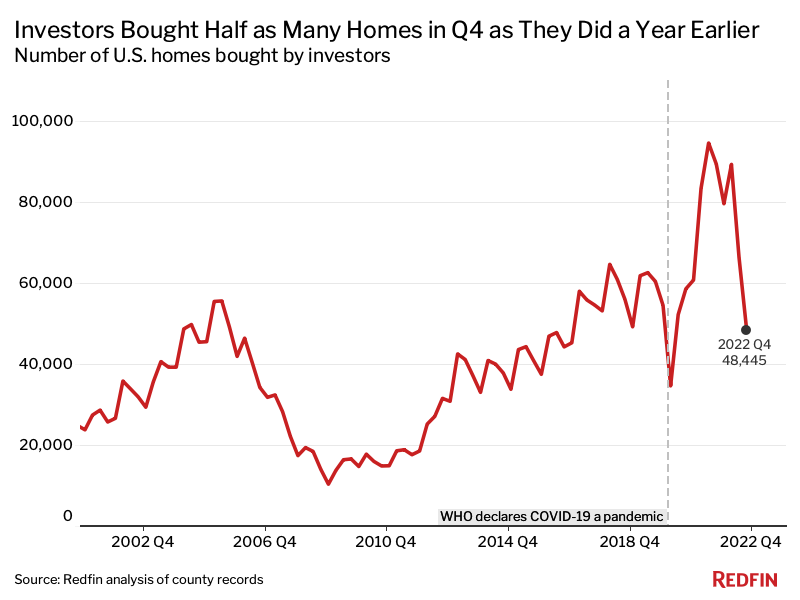
Wall Street investor purchases of U.S. homes fell a record 45.8% year over year in the fourth quarter amid soaring interest rates as the high cost of borrowing money and the prospect of substantial home-price declines made real estate investing less attractive. The second biggest decline occurred in 2008, when investor purchases slumped 45.1% during the subprime mortgage crisis.
Overall U.S. home purchases fell 40.8% from a year earlier in the fourth quarter.
Investor purchases slumped 27% on a quarter-over-quarter basis, the largest quarterly decline on record aside from the beginning of the pandemic. That’s comparable with the 28.1% quarterly drop in overall home purchases.
While many investors have pumped the brakes on homebuying, investor market share has remained fairly steady. That’s because individual homebuyers have also pulled back. Investors purchased 17.8% of all homes that were bought in the metros tracked by Redfin in the fourth quarter. That’s comparable with 17.6% in the prior quarter and down from 19.4% a year earlier.
Investors bought $31 billion worth of homes in the fourth quarter, down 42.7% from $54.1 billion one year earlier and down 27.5% from $42.8 billion one quarter earlier. The typical home investors purchased cost $425,926, little changed from one year earlier but down 5.8% from one quarter earlier.
Investors piled into the housing market in 2021 due to rock-bottom mortgage rates and surging housing demand, and are now retreating amid projections that home prices have room to fall.
U.S. home prices are up less than 1% year over year—compared with 15% growth one year ago—and have fallen 11% from their spring 2022 peak. In many metros, prices are already declining on a year-over-year basis. That’s because the jump in mortgage rates last year dampened homebuyer demand. Higher rates also mean it’s more expensive to borrow money, which eats into profits. Many investors are moving their money into other asset classes that offer better returns. For investors who are landlords, slowing rent growth is also making it more challenging to reap large returns.
Investor home purchases in the fourth quarter of 2021 were near their record high, which is another reason the year-over-year decline in 2022 was so dramatic. Investors bought 48,445 homes in the metros tracked by Redfin in the fourth quarter of 2022, down from 89,396 a year earlier and 60,447 in the fourth quarter of 2019—before the pandemic.
You know what they say: there’s no better wingman/woman than a real estate agent! When you’re with them, the world is your oyster (or your five-acre ranch, your beachfront villa, you name it.) Here are the top 10 reasons why you should absolutely and positively date or marry a real estate agent:
They’re always in the know so you’ll have the inside scoop on all the hottest restaurants, bars, and nightclubs in town and they know how to get you into the hottest properties, even if they’re completely out of your league (kind of like how they’ll sweep you off your feet!)
They’re always bringing you around to new places and showing you their listings, so you’ll never have a dull moment with them and will never get bored with the same old date spots.
They’ve got the keys to your heart (and a whole bunch of other keys too)!
They’ve got a sixth sense when it comes to reading people, so they’ll always know exactly what you’re thinking (and vice versa). They’ll never steer you in the wrong direction because they know the importance of a good foundation (in a house and in a relationship!)
They’re experts at finding hidden gems and turning them into diamonds in the rough, so if you’re feeling overlooked or undervalued, they’ll know just how to make you shine.
They’ve got a keen eye for curb appeal so they’ll know how to make you look good (literally and figuratively) and they know that beauty is more than skin deep, so they’ll appreciate you for who you are on the inside.
They’re used to handling high-pressure situations with ease and have plenty of experience dealing with difficult clients, so they’ll be able to handle any argument or disagreement that comes up in your relationship and be cool as cucumbers (and probably find a way to negotiate a win-win solution).
They’ve got a knack for solving problems, so they’ll always know how to fix whatever’s broken in your relationship (and if all else fails, they can always stage a breakup scene and flip it for profit).
They’re great at juggling multiple tasks and responsibilities, so you’ll never have to worry about them neglecting you for their work (unless, of course, they find a really good listing, in which case you might have to fend for yourself for a few hours).
They’re masters of negotiation communicating clearly and concisely, so you’ll never have to worry about misinterpreting their signals or intentions (unless they start speaking in real estate jargon, in which case you’re on your own).
Have you ever dated or married a real estate agent? What would you add to this list (besides a grain of salt)?
P.S. If you have real estate questions or interested in buying or selling a home in Northeast Florida, please contact me at (904) 307-8998 or email williamvasana@kw.com. As a local area expert in Jacksonville Florida, I offer the highest level of professional services, luxury condo savvy, extensive residential experience, and intensive knowledge about Jacksonville neighborhoods and the overall market in the pre-construction and luxury development. I specialize in residential homes, condominiums, waterfront properties and new construction homes in Duval, St. Johns and Clay counties.
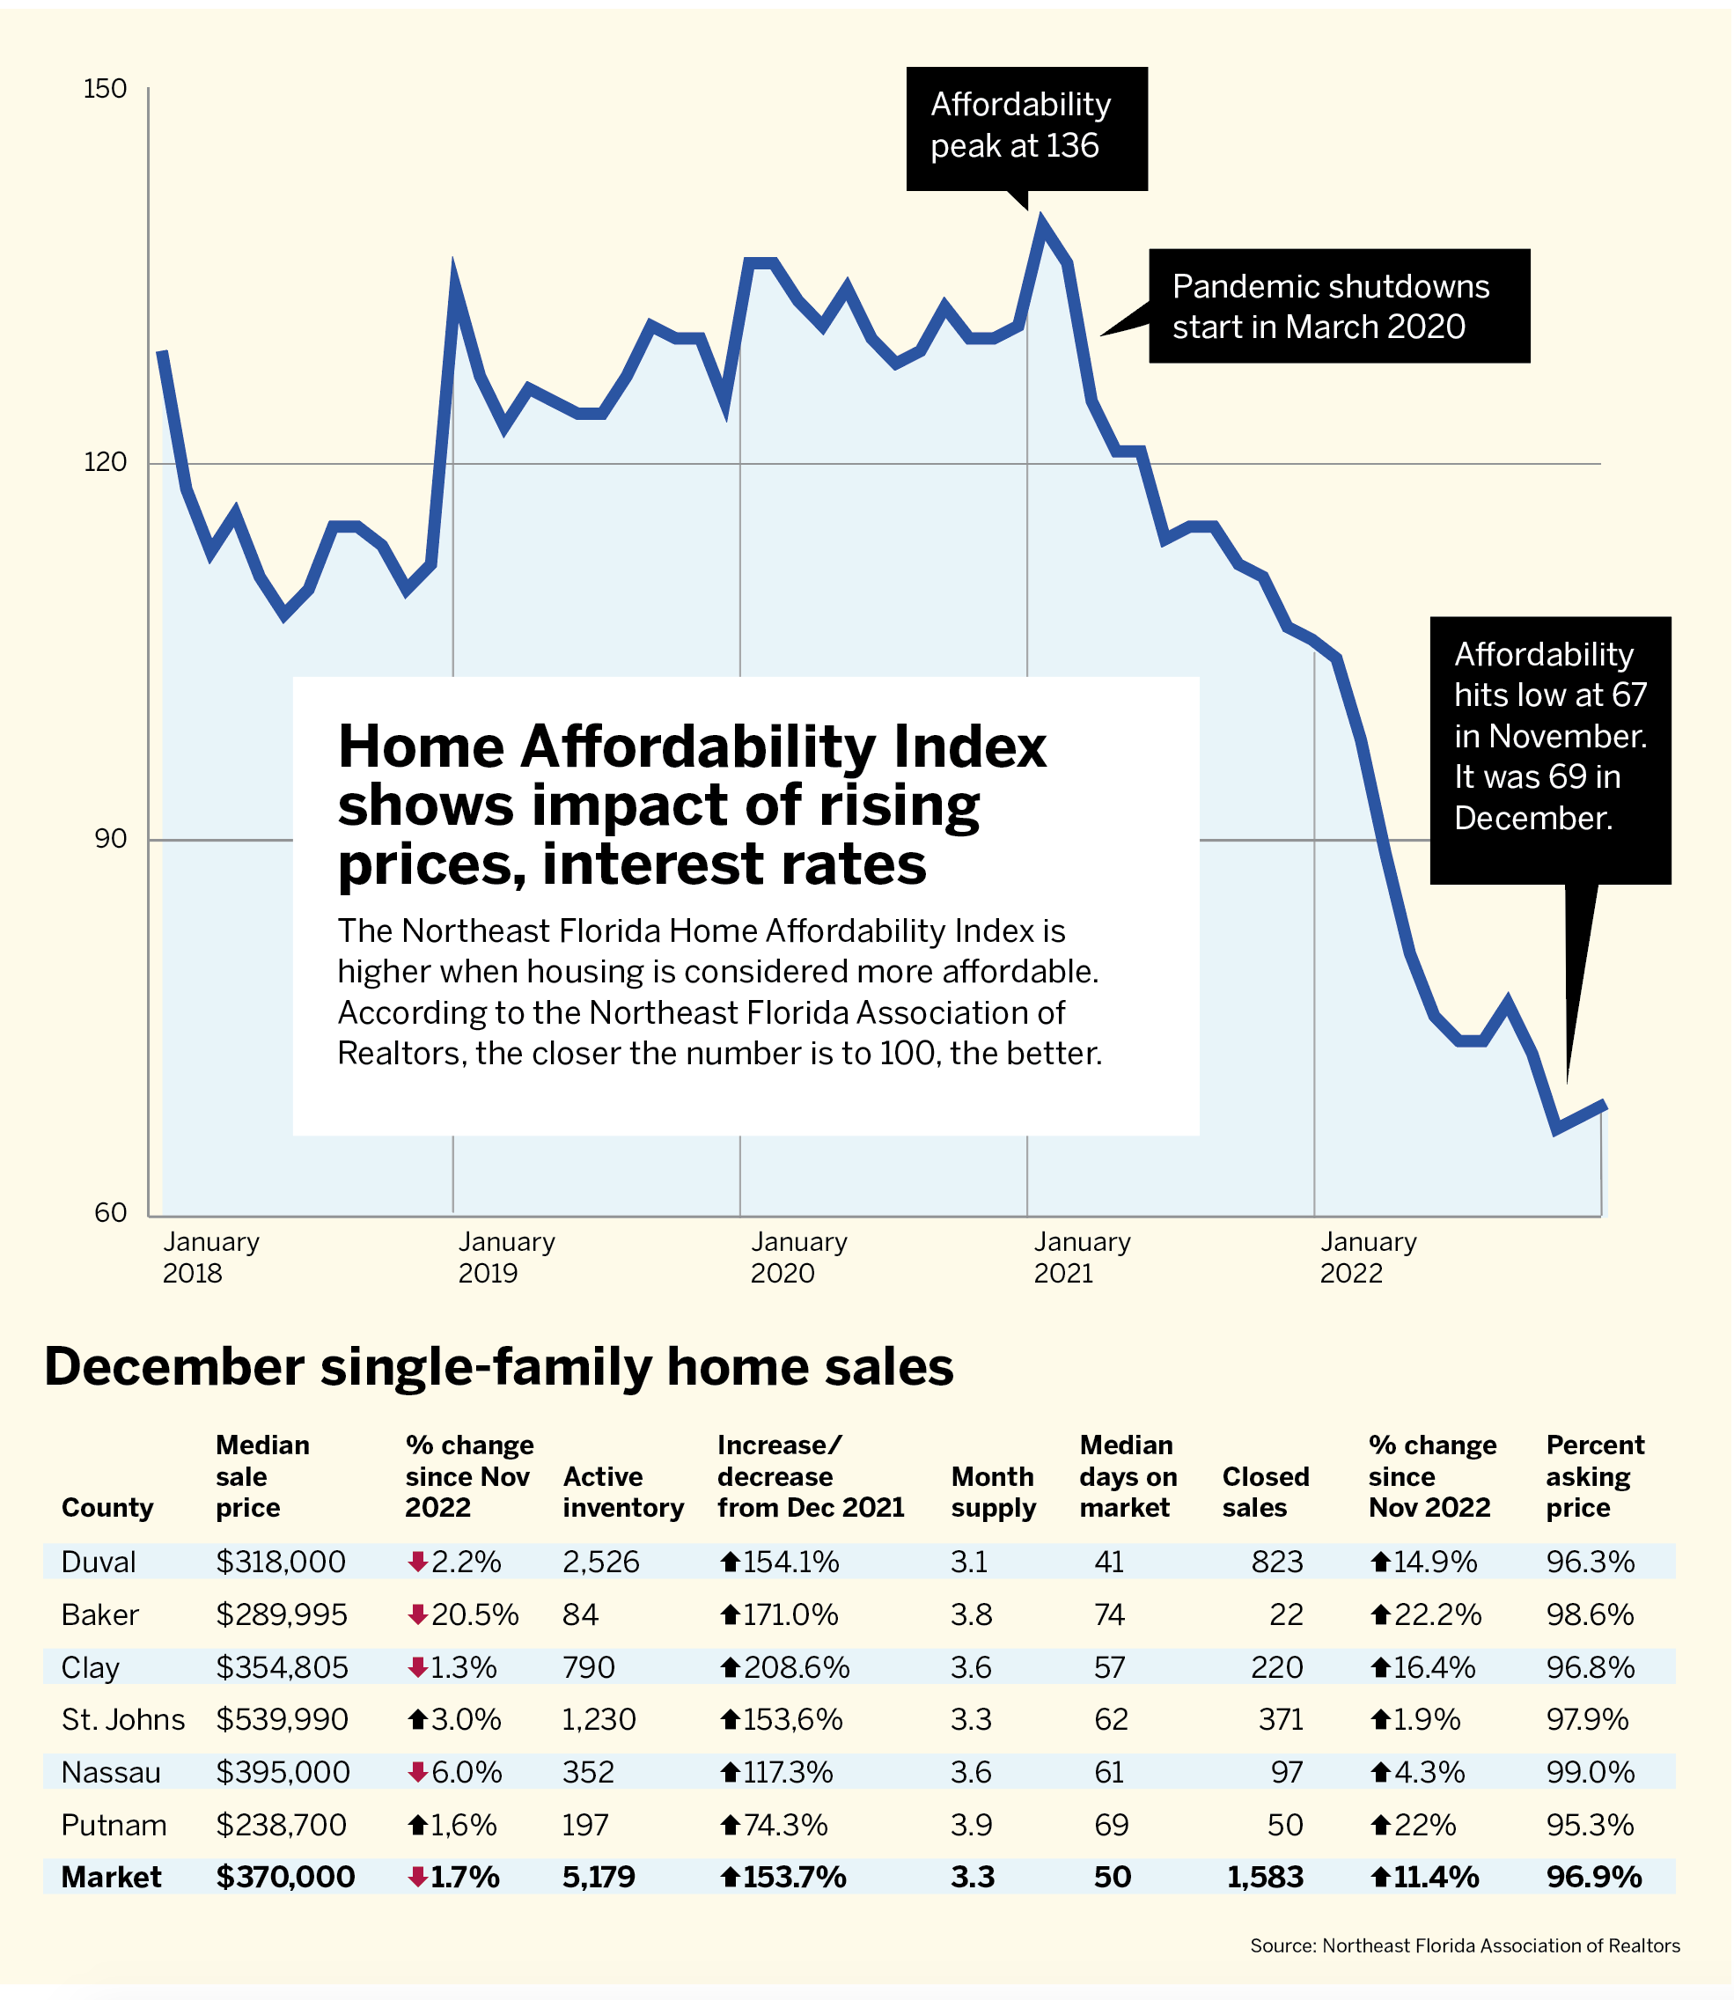
The Home Affordability Index for single-family homes in Northeast Florida fell steadily in 2022 from 104.5 in January to 69 in December. The index had dropped 34.9% in 12 months. The closer the index is to 100 or higher, the better.
The major factor in the lowering of the index throughout 2022 has been the dramatic increase in mortgage interest rates from around 3% to over 7% at the peak.
Throughout the year, prospective buyers were priced out of the market.
The first half of the year showed increasing costs, low inventory and listings lasting little more than a week.
The second half found median prices stabilizing, increased inventory and a greater number of choices for buyers.
The median price of a single-family home fell 1.7% in December to $370,000 from $376,385 in November.
The December 2022 median price was 5.7% higher than in December 2021.
Single-family home sales usually fall in December because of the holidays.
December 2022, however, was different from December 2021.
There were 1,583 closings, down 38.4% from 2,570 in December 2021.
Pending sales also showed a decline, with a 31.9% drop to 1,324 in December 2022 compared with 1,944 in December 2021.
The closed and pending unit sales in the combined single-family, condo and townhouse market in Northeast Florida has been relatively stable for the past 3-4 months with just slight movement month over month as we would expect in line with the seasonality of a ‘normal’ real estate market.
Days on market is now a median of 50 days, which is more typical for a balanced market while only a 3.2-month supply is still considered a ‘sellers’ market.
The number of new listings coming on the market is following the historic seasonality with fewer new listings during the holidays and an anticipation of an uptick in mid to late spring.
When condos and town home sales are added, the median price for the three home types combined was $345,00 in December, similar to the March 2022 median price of $350,000.
It peaked in July 2022 at a median of $375,000.
Bottom line: The housing market is normalizing and this is a good sign.
Source: Jacksonville Daily Record and Northeast Florida Association of Realtors
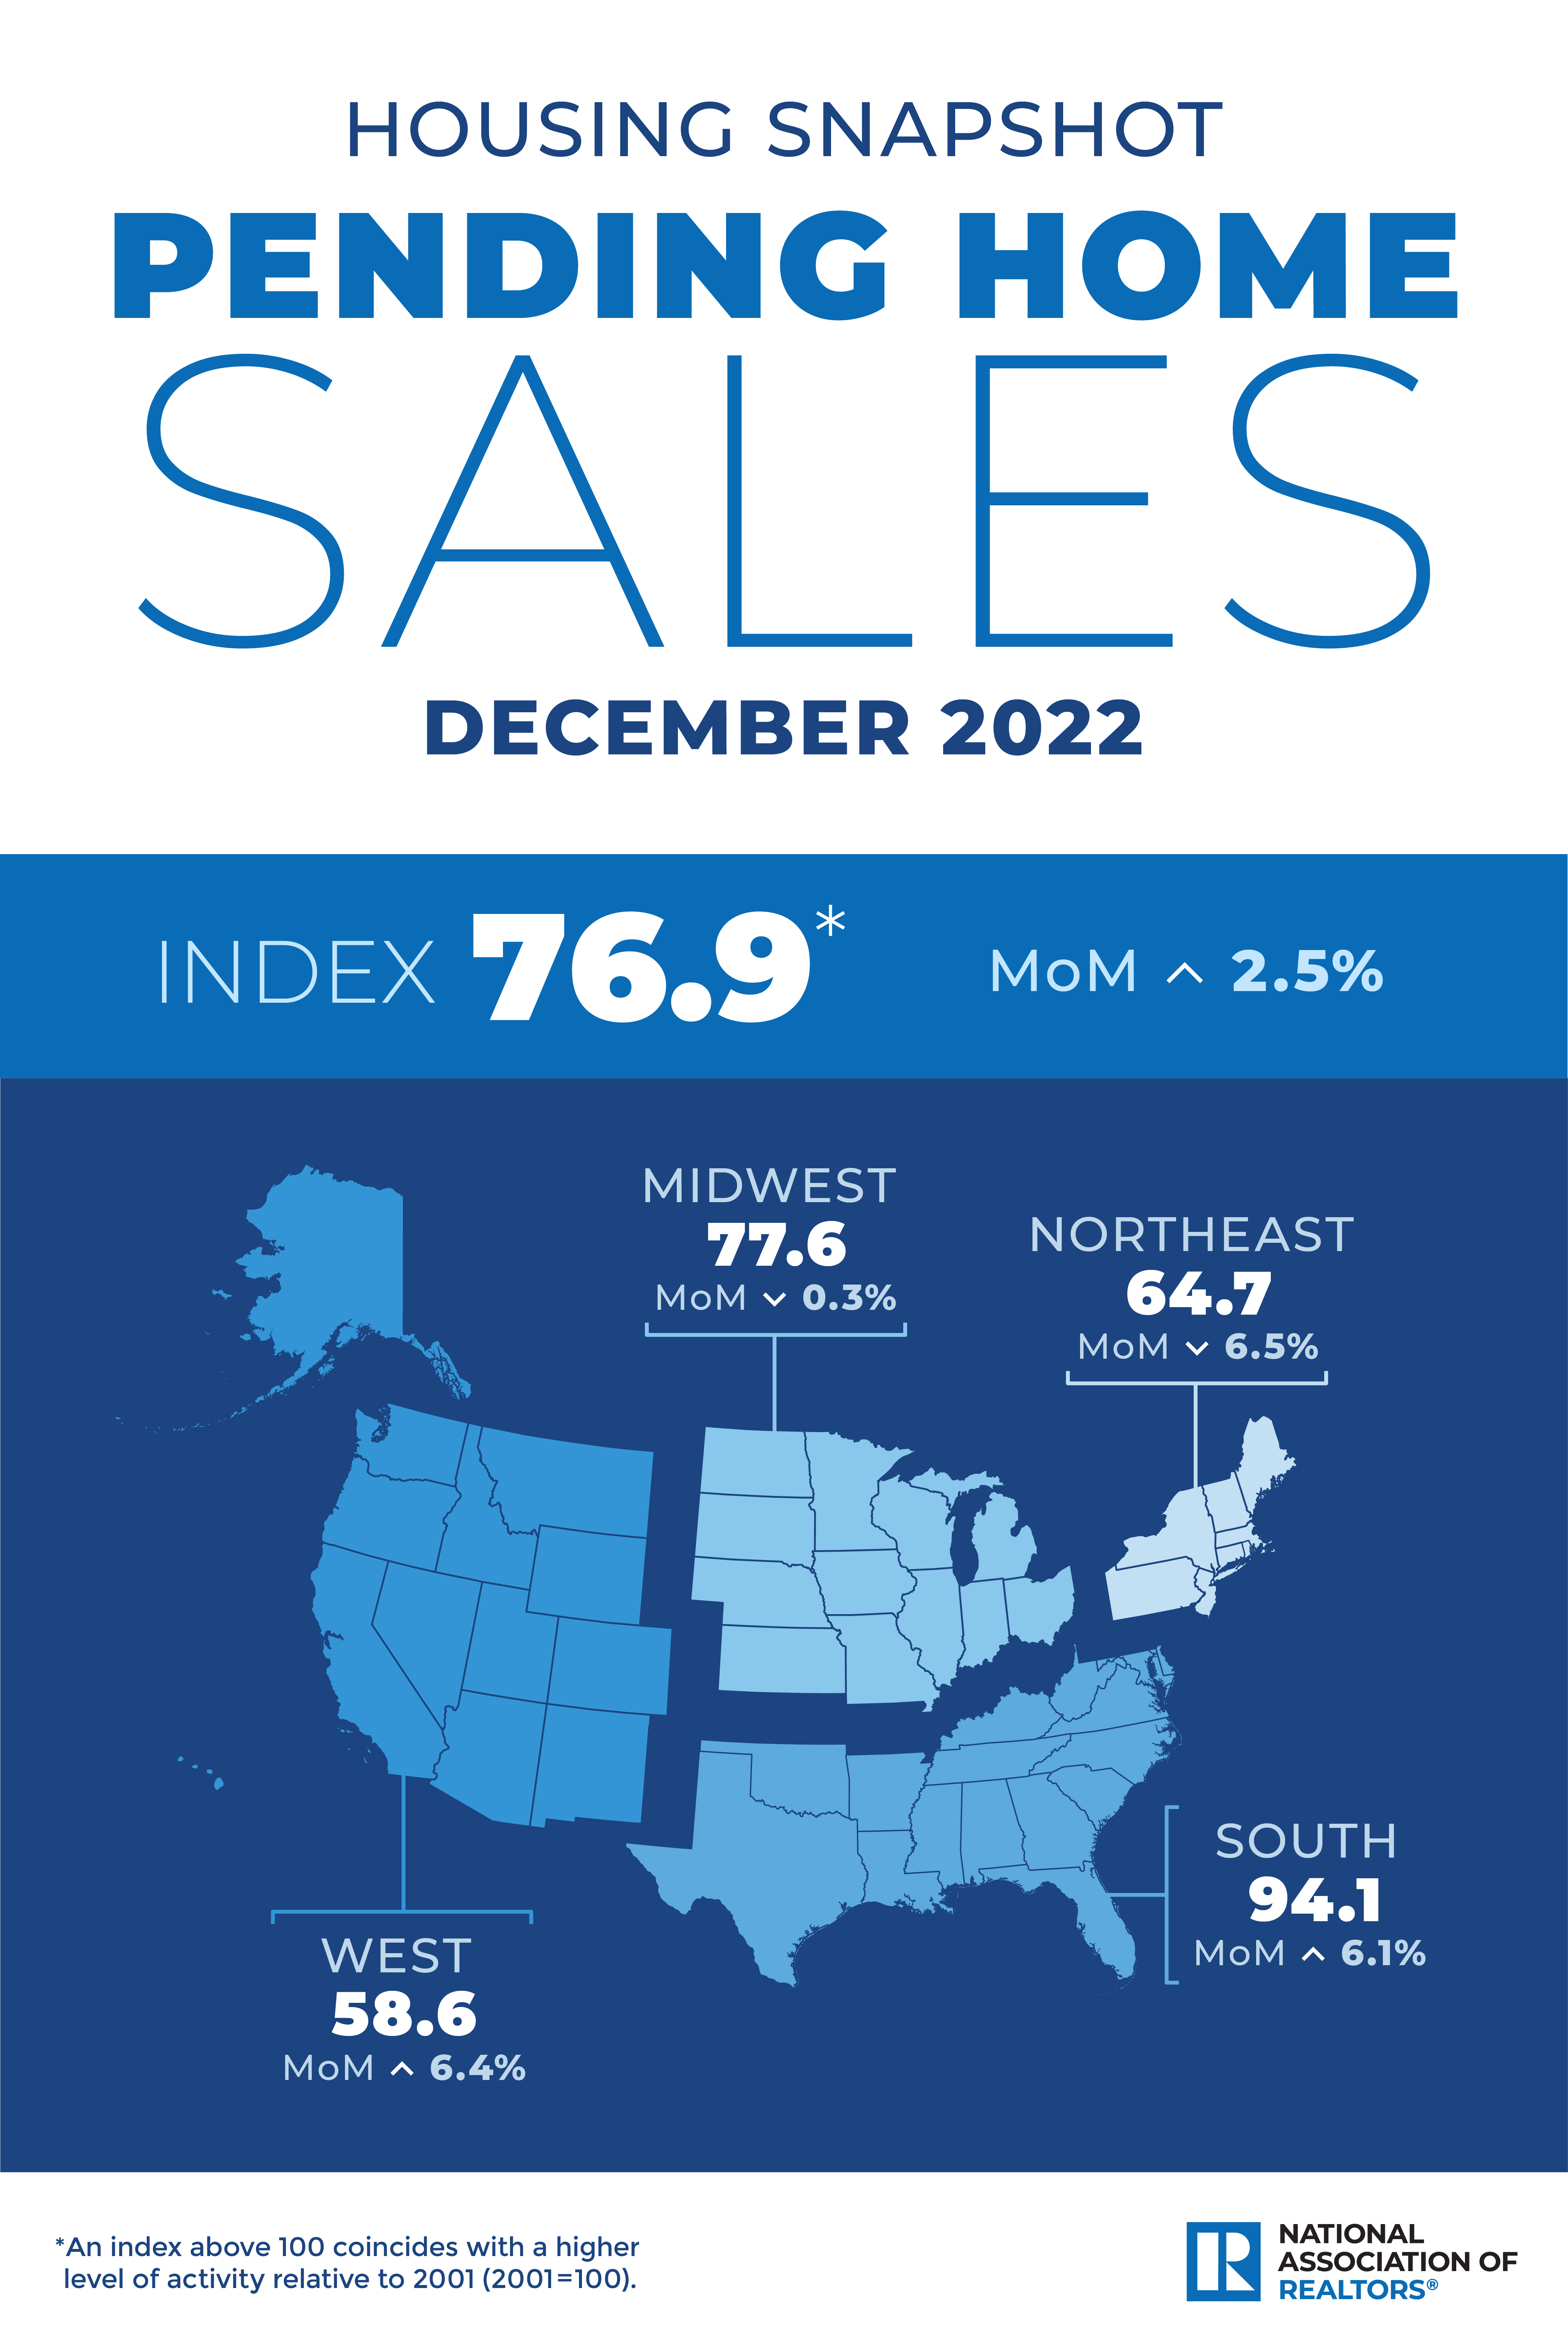
Pending home sales improved for the first time since May, up 2.5% from November, according to the National Association of Realtors. Month-over-month, contract signings fell in the Northeast and Midwest but climbed in the South and West. All four U.S. regions saw pending sales declined in transactions compared to one year ago, with the West experiencing the largest decline at 37.5%.
“This recent low point in home sales activity is likely over,” said NAR Chief Economist Lawrence Yun. “Mortgage rates are the dominant factor driving home sales, and recent declines in rates are clearly helping to stabilize the market.”
Pending Home Sales Regional Breakdown
The Northeast PHSI dropped 6.5% from last month to 64.7, a decrease of 32.5% from December 2021. The Midwest index shrank 0.3% to 77.6 in December, a decline of 30.1% from one year ago.
The South PHSI rose 6.1% to 94.1 in December, dropping 34.5% from the prior year. The West index advanced 6.4% in December to 58.6, decreasing 37.5% from December 2021.
“The new normal for mortgage rates will likely be in the 5.5% to 6.5% range,” Yun added. “Job gains will steadily become important in driving local home-sales markets. The South, in particular, is set to outperform the rest of the country, thanks primarily to better job market conditions in this part of the country compared to other regions.”
It is expected that the Feds will raise the interest rates by 25-basis-point when meeting next week. The Feds will plan one more rate increase in Q1, ending rate hikes by March as inflation slows. A key measure of inflation climbed at its slowest pace in more than a year in December, a sign that the Federal Reserve’s efforts to rein in fast-rising prices are working. University of Michigan showed US inflation expectations continued to retreat in late January, helping boost consumer sentiment.
Key US Inflation Gauges Continue to Retreat
Personal spending, adjusted for changes in prices, dropped 0.3% in December. Inflation-adjusted outlays for merchandise fell 0.9%, while spending on services stagnated, the first month without an increase since January 2022.
The median estimates in a Bloomberg survey of economists were for a 0.3% advance in the core PCE price index and for no change in the overall measure on a monthly basis. The S&P 500 fluctuated as traders weighed corporate earnings while Treasury yields remained higher.
The figures added to mounting evidence that the worst bout of inflation in a generation has passed as the Fed’s aggressive tightening campaign works its way through the economy. Officials are widely expected to once again slow the pace of rate hikes, to a quarter point next week, and will discuss how much higher they need to go to ensure prices are cooling for good.
Policymakers are adamant that their work isn’t yet done, as a tight labor market threatens to keep upward pressure on wages and prices. They also point to price growth in services excluding energy and housing, which ticked up slightly to 0.32% last month, according to Bloomberg calculations.
The Fed’s hawkish stance has many economists worried the central bank will go too far, assigning a 65% chance of a recession over the next year. Several officials still maintain that a soft landing is possible, a scenario in which inflation cools without a surge in unemployment.
Americans, whose wages have lagged inflation throughout the pandemic, have been relying on credit cards and tapping into savings to support purchases. The saving rate rose to 3.4% in December, the biggest monthly increase since July 2021, the Commerce Department report showed.
The report showed a pullback in discretionary spending, particularly on categories like restaurants and hotel stays. On the goods side, purchases on apparel and footwear also dropped.
Personal income, unadjusted for inflation, as well as real disposable income, climbed 0.2% last month. Wages and salaries, unadjusted for prices, advanced 0.3% from November.
The Fed will get more data on the labor market next week, including the fourth-quarter employment cost index — a broad gauge of wages and benefits — as well as December job openings before the conclusion of its two-day meeting on Feb. 1. The January payrolls report will be released on Feb. 3.
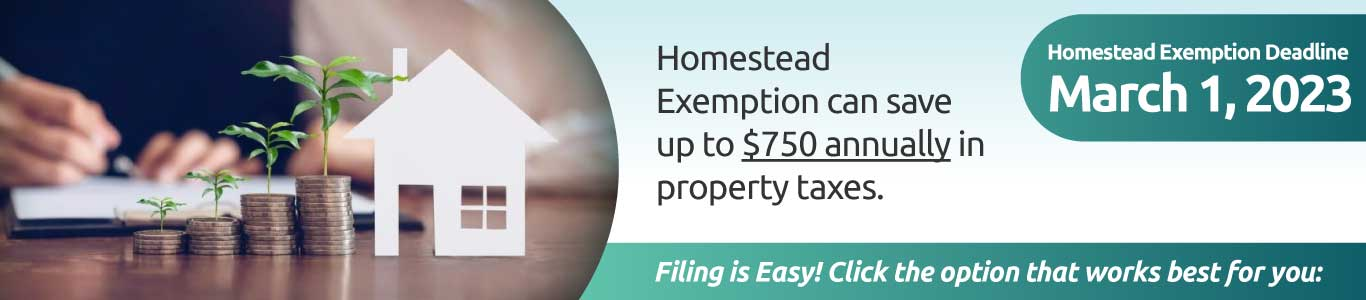
Did you buy a home in Florida in 2022? If so, the deadline to file for the Florida homestead exemption is before March 1st, 2023. In order to claim your homestead exemption, the property must be designated as the owners’ principal domicile with the County Tax Assessor by March 1, 2023.
What is the Florida Homestead Exemption?
One of the reasons for the high costs of homeownership in Florida is property taxes. The amount you pay can differ according to the city or even the county. If you already own a home in Florida or are looking to buy one, the homestead exemption can help you to reduce your tax burden.
With the homestead exemption, you can reduce the taxable value of your home by as much as $50,000. It’s offered based on your home’s assessed value and provides exemptions within a certain value limit.
Who is Eligible for the Homestead Exemption?
While the tax savings could be significant, not everyone is eligible for it. Before you apply for the homestead exemption, ensure that you meet the following requirements:
You are the property owner.
The property you want to claim the exemption for must be your permanent residence.
The property you want to claim should be the permanent residence of someone you can claim as a dependent on your taxes.
You must have lived at the property on January 1 of the tax year in question. For instance, if you hope to claim the homestead exemption on your 2023 taxes, you must have lived at the property in question on January 1, 2023. You should not have rented the property for more than 30 days in a given calendar year. This is because renting the property for more than 30 days for two consecutive years or for more than six months is considered an abandonment of the Florida homestead exemption.
Why file for Homestead Exemption?
Tax Savings: Florida residents are entitled to a homestead exemption of up to $50,000.
Cap on Tax Assessment Rate Increases: the annual rate increase on assessed value is limited to 3%
Where to apply?
Owners should apply in person, or online in some counties, with the property appraiser’s office in the county in which the property is located.
What information is required?
It varies by County, but generally you will need the following:
Your recorded deed or deed or tax bill
Florida Driver’s License or State ID (must show primary residence)
Vehicle registration (must show primary residence)
Please Note: If the title to the property on which you are applying is held in a trust, a copy of the entire trust agreement must be submitted with the application.
In a recent article, Forbes ranked Jacksonville number 2 on the Best Places to Live in Florida beating out Miami, Orlando, Tallahassee, and others! Tampa took to the top spot. Jacksonville is known for its thriving economy, lower cost of living, picturesque beaches, and so much more. You can read the full article here.
It’s easy living here in the Bold City. With great beaches, waterways and a melting pot of culture, it’s no secret that our city is truly one-of-a-kind.
How did Forbes come up with their rankings? They compared Florida metropolitan areas using data from several platforms to measure variable criteria for home affordability, healthy employment and population growth.
“While Jacksonville holds the honor of being Florida’s largest city by population, its combined metro area population is smaller than Miami and Tampa,” writes Josh Patoka. “You can enjoy big city conveniences and live on the Atlantic Ocean—yet the living costs are relatively affordable.”
Forbes says banking, healthcare and transportation are the seven-county metro area’s biggest employment opportunities.
“The city is also home to one of the nation’s three Mayo Clinics and offers access to many of Florida’s best banks,” says Patoka.
If you’re looking for a livable city that’s accessible to beaches, waterways, outdoor activities and a melting pot of culture, then Jacksonville might be the city for you.
Jacksonville made a big leap in the rankings of US News & World Report’s Best Places to Live in Florida, moving from 11th place in 2021 to 4th this year. Only Sarasota, Naples and Melbourne finished higher on the Florida list. Jacksonville also ranks 24th Best Places to Live and 26th in Best Places to Retire in the nation.
The annual list ranks 150 of the largest U.S. municipalities, weighing factors such as unemployment rate, housing costs, household income, crime rate, education, health care and air quality to determine the rankings.
San Jose, Calif.; Grand Rapids, Mich.; Washington, D.C.; Albany, N.Y.; and Boston moved ahead of Jacksonville in the overall ratings. Jacksonville, at number 24 on the list, jumped over Denver, Seattle, Charlotte and Fort Collins, Colo.
Huntsville, Ala., finished first on the list, up from third in 2021. Sarasota, at number 9, was the highest-rated city in Florida on the national list. Naples and Melbourne also finished in the top 20.
U.S. home prices have surged since the pandemic. The S&P CoreLogic Case-Shiller home price index showed a 19% jump in housing prices in 2021. The Florida Realtors’ year-end report showed a 20% jump in home prices in 2021.
The pandemic didn’t jumpstart a slow real estate market. It simply added fuel to the fire. While 2021 home gains were strong, they’re part of a five-year trend where housing prices increased by 69%.
Rising home prices continue to surge until they don’t. Some investors may remember the dot-com stocks losing 90% of their value after the bubble burst. More investors remember the Great Recession, an economic disaster that saw millions of homes went into foreclosure.
Home prices leading up to the Great Recession kept rising with no signs of slowing down. The price movement leading up to the Great Recession looks similar to the current market, but there are some key differences between today’s real estate market and the early to mid 2000’s.
What Happened During the Great Recession?
During the Great Recession, millions of people lost their homes and the stock market crashed. It took several years for the economy to recover, but some retail investors never made up their gains. These consequences have made many people fearful of the current market. Some investors are waiting on the sidelines for a crash before buying properties.
The Great Recession was several years in the making. Policy mistakes and questionable decisions from financial institutions enabled that event to occur. Lenders were incentivized to hand out as many loans as possible. Each loan represented another income stream, and the housing market felt unstoppable.
Along the way, lenders relaxed their lending guidelines and gave loans to practically anyone. Borrowers with poor credit could qualify for a subprime loan. Lenders didn’t care if borrowers didn’t have any income, job, or assets.
Many borrowers had no chance of repaying the loan after the introductory rates expired. After a decade of extended prosperity, lenders didn’t mind the risks. Borrowers who lived beyond their means ignored the risks or didn’t think of them. Subprime borrowers suddenly had an opportunity to capitalize on the booming real estate market.
Reality eventually set in, and borrowers with no income, job, or assets couldn’t keep up with the loan payments. These borrowers desperately tried to sell their properties before getting forced into foreclosure. As more sellers list their properties, the remaining buyers gain leverage. Buyers could get bargain prices because sellers desperately needed to get out of their loan obligations.
Wall Street managed to make the situation work by creating collateralized debt obligations around these risky loans. Big banks bought up shares with leverage, giving them dangerous exposure to these dynamics. When the house of cards fell, greedy executives and big banks lost billions of dollars. The major credit bureau stamped these assets with an AAA rating, indicating these assets were the safest in the market.
Why People Think We Are in a Real Estate Bubble
The current real estate market doesn’t have the same dynamics as the Great Recession, but some signs suggest a possible correction. Inflation and interest rate hikes are real concerns. Investors wonder if homeowners can keep up with mortgage payments if costs continue rising.
The Consumer Price Index jumped 8.5% in March, making it the highest increase since 1981. The Fed also projected several interest rate hikes this year. Higher interest rates reduce the number of buyers looking for a home. Sellers may have to lower their prices to match decreased buyer demand.
The Fed also raised rates leading up to the Great Recession. Between June 2004 and June 2006, the interest rate jumped from 1.3% to 5.3%. Borrowers with variable loans felt the higher interest rates and couldn’t keep up with their loans.
Some homeowners may struggle with their loan payments and inflation. The real estate market may see an uptick in foreclosures as costs continue rising, but this economic environment isn’t like 2008.
The Great Recession’s Aftermath Created Vital Safeguards
The Great Recession taught investors many lessons, and regulation became stricter. Lenders could no longer get away with subprime mortgages to applicants with no income, job, or assets. Lenders are less than two decades removed from the Great Recession, making them more conscious of the risks.
To qualify for a mortgage, borrowers need sufficient credit scores, debt-to-income ratios, and other financials. These parameters result in more qualified buyers who can keep up with mortgage payments. During the Great Recession, lenders happily handed out loans, regardless of whether an applicant could pay the loan off or not. Regulators fell asleep at the helm and didn’t stop the lenders from handing out these risky loans.
If we see an uptick in foreclosures, it shouldn’t look as bad as the Great Recession. Rising interest rates won’t hurt homeowners with fixed-rate mortgages, while homeowners with variable-rate mortgages will feel the impact. The Fed raises interest rates to fight off inflation, which can help homeowners with fixed payments.
Decelerating inflation can return some control to skyrocketing prices, helping homeowners keep up with fixed-rate mortgage payments and other expenses. The current homeowner is far different from a pre-Recession homeowner who may have earned no income but owned three properties. Safeguards created in response to the Great Recession offer many protections that mitigate the risks of a repeat.
Real Estate Prices Rely on Supply and Demand
Supply and demand dictate the economy. These dynamics can cause prices to skyrocket or collapse depending on the economy’s direction. Millions of foreclosures created many opportunities, but a higher supply reduced demand.
Qualified buyers could get picky and obtain favorable terms from sellers and lenders. The Great Recession was an incredible opportunity for investors who stayed on the sidelines and capitalized on the sudden increase in supply.
Real estate demand is still strong, especially in Florida. The state saw 167% more move-ins than move-outs in 2020. The following year was also strong, with 43% more move-ins than move-outs. People from expensive states like New York, New Jersey, and California moved to Florida during the pandemic to escape higher living costs. Americans in the northeast wanted to escape the winter season and stay in sunny Florida instead.
It became less important to live in the city, and people could suddenly work remotely. Florida’s low cost of living and terrific year-round weather made people question why they were paying so much money to live in or near cities like New York City and San Francisco.
Florida’s population has been surging since the 1960s, going from five million residents to over 22 million people. New York has only added two million residents since 1970, and California’s population growth rate has slowed down substantially in recent years.
A population boom doesn’t change the supply of real estate. More buyers and the same supply lead to higher prices and bidding wars. As homeowners hold onto their properties instead of listing them on the market, available listings become more valuable. Due to inflation and the Fed’s interest rate hikes, few buyers may enter the market.
However, a low supply of real estate can offset a decrease in buyers. A population boom such as what Florida has experienced in recent years increases the pool of buyers, leaving sellers with more control over housing prices.
The biggest worldwide jump over the past year in luxury housing prices is in South Florida.
Prices for luxury housing in Miami jumped more than a quarter from 2020 to 2021, according to an analysis by the British-based firm, Knight Frank.
The firm analyzed price changes for the “most desirable and expensive property in a given location,” which is generally defined as the top 5% in the market by value for 46 cities across the world.
It is the first time Miami has topped the high-end residential price index since it was created in 2007, according to the Miami Herald.
“The hunt for larger accommodation, coastal living, and Florida’s low taxes acted as a key draw for a new breed of remote workers in the U.S.,” the report said.
Other cities with double-digit jumps in luxury home prices over the year were Seoul at 23%, Shanghai at 21%, Moscow at 21%, Toronto at 20%, and San Francisco at 20%.
According to LinkedIn data, Jacksonville is the number one city in the U.S. with the largest increase in their inflow-to-outflow ratios from April through August, compared to last year.
According to LinkedIn data, Jacksonville is the number one city in the U.S. with the largest increase in their inflow-to-outflow ratios from April through August, compared to last year.
In the most striking switch, two giant metro areas — New York and the San Francisco Bay Area — aren’t coveted destinations anymore. Instead, as the chart above shows, from April through August of this year, the inflow-to-outflow ratios in those two cities have declined more than 20%, versus a year earlier. In both cases, departures now significantly exceeded new arrivals.
Affluent New Yorkers have forsaken city life in favor of second homes in rural areas, CNBC reports. Many of those moves may turn out to be temporary, but some may be permanent. Meanwhile, The New York Times reports a surge of home-buying in New York’s suburbs.
It’s a similar story in the San Francisco Bay Area. Many tech companies have switched to an extended work-from-home routine — and employees are becoming increasingly bold in deciding where that “home” should be. Schools near Lake Tahoe, nearly 200 miles northeast of San Francisco, are awash with applications from families that have relocated from the Bay Area, The Financial Times recently reported.
The inflow-to-outflow ratios are down about 10% in Seattle, Boston and Portland, Ore., as well, for the April-through-August period, relative to a year earlier, according to LinkedIn data.
Seattle and Portland are still seeing an overall influx of people, but just at a lower rate than before. By contrast, Boston is seeing net departures, making it one of nearly a dozen sizable U.S. cities confronting the prospect of de-urbanization.
Everyone leaving a metro area must go somewhere — and that’s creating opportunities elsewhere. Some of this motion is circular, with people leaving Boston most likely to opt for San Francisco, Los Angeles or Seattle, according to LinkedIn data.
Overall, though, a sizable share of departees is opting for somewhere smaller and more affordable. New Yorkers’ top 10 destinations include Miami, Charlotte and Denver. People leaving Seattle gravitate toward Phoenix, Boise and Bend, Ore.
One way to see the growing appeal of smaller cities is to look at the five U.S. cities with the largest increase in their inflow-to-outflow ratios from April through August, versus a year earlier. These cities are Jacksonville, Fla. (+10.7%), Salt Lake City (+9.6%), Sacramento, Calif. (+7.6%), Milwaukee (+4.5%), and Kansas City, Mo. (+3.9%), according to LinkedIn data.
Both Salt Lake and Sacramento portray themselves as benefitting from northern California’s exodus.
“We don’t need to be in Silicon Valley,” says Robert Wood, chief executive officer of digital license-plate maker Reviver. He relocated the company to Sacramento earlier this year, uprooting it from the San Francisco suburb of Foster City, Calif. Lower costs and growing acceptance of a work-anywhere attitude in response to pandemic dislocations helped spur that decision.
Similarly, “Salt Lake City has set its sights on bringing in more high-tech industry, particularly in life sciences,” journalist Emma Penrod wrote in Utah Business last month. “And COVID-19 could end up being a blessing in disguise.
As for Jacksonville, Milwaukee and Kansas City, all three are benefiting from relatively strong economies this year. Jacksonville is gaining as a logistics hub, including a new Amazon fulfillment center. Milwaukee is catching an updraft from Wisconsin’s relatively low unemployment rate: 6.2% in August compared with the national average of 8.4%.
Another way to track people’s destinations is to focus on the metro areas with the highest inflows per outflow — even if that ratio isn’t markedly different from a year earlier. By this method, cities such as Austin, Phoenix, Jacksonville, Tampa and Charlotte, N.C., rise to the top.
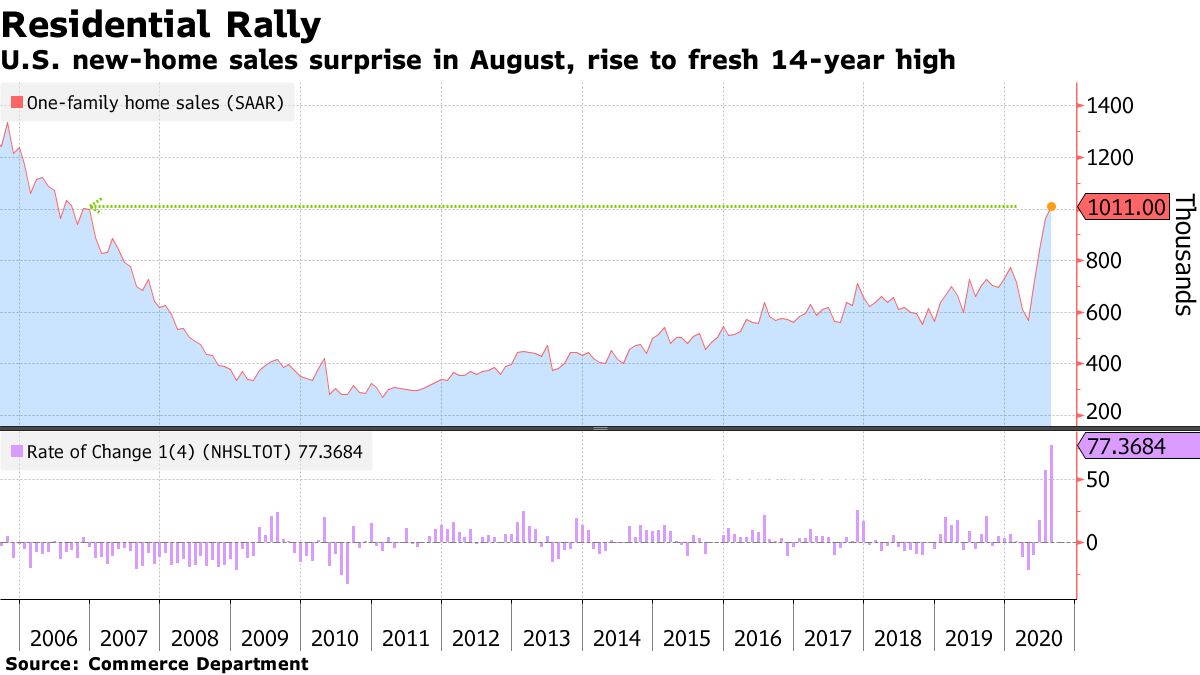
Sales of new homes in the U.S. advanced for a fourth month in August to the highest level in almost 14 years as record-low mortgage rates continued to entice buyers into a market with ever-shrinking supply.
Purchases of new single-family houses increased 4.8% to a 1 million annualized pace, led by a flurry of demand in the South, after an upwardly revised 14.7% surge in July. The median selling price decreased from a year earlier to $312,800 and the number of homes for sale dropped to an almost three-year low. Economists expected an 890,000 pace, according to the median estimate in a Bloomberg survey.
U.S. new-home sales surprise in August, rise to fresh 14-year high The data are the latest to highlight momentum in the housing market, driven by low borrowing costs and a desire for new property during a pandemic that’s led to many more Americans to work from home. At the same time, it’s difficult to gauge how long such robust demand will last, given the scale of layoffs and the potential for future job cuts without a federal fiscal aid package.
The annual rate of sales in the last four months has increased more than 77%, the most for a comparable period since 1980.
Sales rose in two of four regions led by the South — the largest region — where purchases surged 13.4% to the highest level since 2005. Demand also increased in the Northeast.
The supply of new homes continued to fall. At the current sales pace, it would take 3.3 months to exhaust the supply, the shortest time frame in records to 1963.
The 4.3% decline in the median selling price from a year ago reflected the composition of homes sold. Some 34,000 properties priced from $200,000 to almost $300,000 were sold, the most in records back to 2002. Meanwhile, fewer properties in the higher end changed hands.
Builder Backlogs It’s the same picture for backlogs: the number of properties sold for which construction hadn’t yet started jumped to 342,000 in August, also the highest since 2006 and a sign builders will be busy for months to come.
Buyers are opting for new homes as fewer homeowners seek to sell their own properties. Mortgage rates are set to remain at historically low levels amid stimulative Federal Reserve monetary policy aimed at shoring up economic activity.
Other figures corroborate the high demand for real estate. Existing home sales strengthened in August to the highest pace since the end of 2006, following a record jump in July. Homebuilder optimism is also at an all-time high, reflecting strong current sales, the demand outlook and increased prospective buyer foot traffic.
The new-home sales report, released jointly by the Census Bureau and Department of Housing and Urban Development, tends to be volatile: it showed 90% confidence that the change in sales last month ranged from a 5.7% decline to a 15.3% increase.
Sales of new U.S. single-family homes increased to their highest level in more than 13-1/2 years in July as the housing market continues to show strong immunity to the COVID-19 pandemic, which has plunged the economy into recession and thrown tens of millions of Americans out of work.
The Commerce Department said new home sales rose 13.9% to a seasonally adjusted annual rate of 901,000 units last month, the highest level since December 2006. New home sales are counted at the signing of a contract, making them a leading housing market indicator. June’s sales pace was revised upward to 791,000 units from the previously reported 776,000 units.
Economists polled by Reuters had forecast new home sales, which account for about 14% of housing market sales, gaining 1.3% to a rate of 785,000-units.
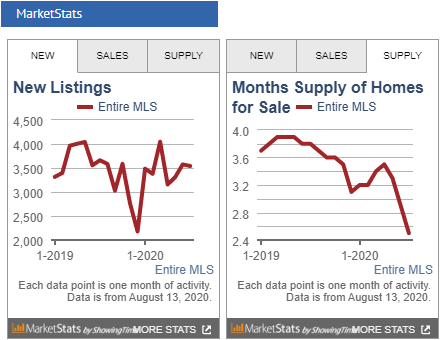
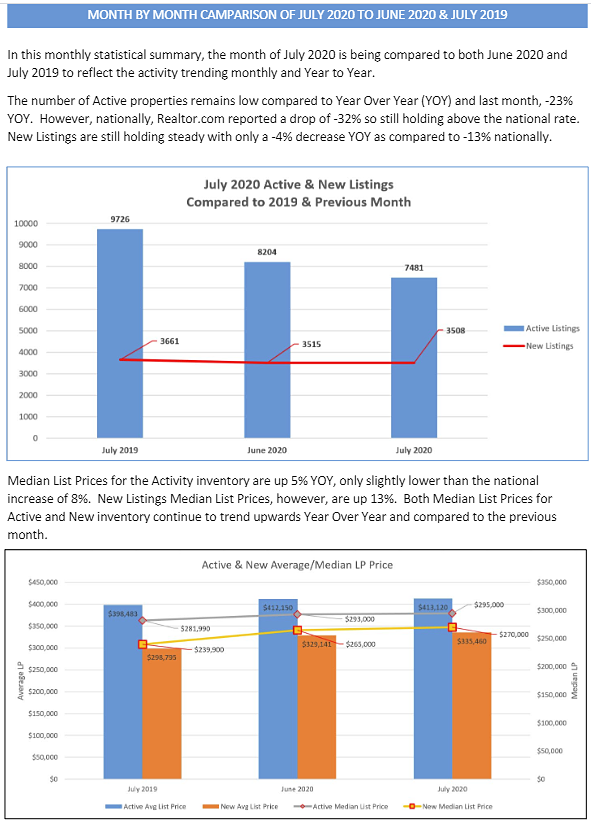
Median List Prices for July inventory in Jacksonville are up 5% from last year.New Listings Median List Prices are up 13%. Both Median List Prices for Active and New inventory continue to trend upwards Year Over Year and compared to the previous month.
Foreign buyers continued to pull back for the second year, purchasing $74 billion of U.S. existing home sales from April 2019–March 2020, a 5% decrease from the prior 12-month period, according to the National Association of REALTORS®. Foreign buyer purchases made up 4% of the $1.7 trillion existing-home sales.
International clients (non-U.S. citizens) who already resided in the United States as recent immigrants or who held visas that allowed them to live in the U.S. for work, business, education purposes (Type B) purchased $41 billion of U.S. existing-home sales, or 61% of the dollar volume of purchases. Foreign buyers who lived abroad (Type A) purchased $33 billion of existing home sales, accounting for 39% of the dollar volume.
Foreign buyer purchases declined as trade tensions escalated between the U.S. and China in 2019, resulting in weaker global economic growth and weaker currencies relative to the dollar — conditions that lower the purchasing power of foreign buyers. The decline in foreign buyer purchases in the 2019 and 2020 NAR reports comes amid a marked drop in foreign direct investment in newly acquired businesses, trade, and persons granted permanent legal residence and non-immigrant visas for businesses, travel, and education since about 2017 and in the wake of regulatory measures of China’s government to closely monitor dollar outflows from China since 2016. The low inventory of homes for sale also constrained the home buying of international and domestic buyers alike. The sustained appreciation in home prices and the weaker currencies relative to the dollar also made a home purchase less affordable for foreign buyers living abroad (Type A).
The U.S. travel bans to control the spread of coronavirus to the United States that took effect from February may also have impacted some transactions that were due to close, but that impact does not appear to be significant based on the monthly REALTORS® Confidence Index survey.
China remains the #1 buyer of U.S. residential real estate despite a steep decline since 2018
Purchases of existing homes of Chinese foreign buyers have declined from $30.4 billion during the 12 months ended March 2018 to just $11.5 billion during the 12 months ended March 2020, but they remain as the largest buyer of residential property, slightly ahead of Canadian buyers who purchased $9.5 billion of existing homes. Mexican buyers purchased $5.8 billion, followed by Asian Indian buyers, at $5.4 Bn. Colombia rounded out the top 5, purchasing $1.3 billion. Colombia replaced the United Kingdom as the 5th largest country of origin of foreign buyers.
For the reference period of April 2019-March 2020, the majority of Canadian (74%) and Colombian buyers (61%) lived abroad (Type A) while only a minority of Asian Indian (11%) and Mexican (31%) buyers lived abroad. Thirty percent of Chinese buyers lived abroad, a decline from 41% during the prior 12-month period.
Florida remains the #1 destination of foreign buyers
Florida remained the major destination, attracting 22% of foreign buyers. Florida’s foreign buyers mostly come from Latin America (35%) and Canada (29%). Florida was the top destination among Canadian and Colombian buyers.
California was the destination of 15% of foreign buyers. Fifty-four percent of California’s foreign buyers came from Asia/Oceania. It was the top destination among Chinese and Asian Indian buyers.
Texas attracted 9% of foreign buyers. Forty-two percent of Texas’ buyers came from Latin America/Caribbean. Texas was the top destination among Mexican buyers.
New York accounted for 5% of foreign buyers, with 51% coming from Asia/Oceania. It was a major destination among Chinese, Asian Indian, and Colombian buyers.
New Jersey accounted for 4% of all buyers. Fifty percent of New Jersey’s buyers came from Asian/Oceania. New Jersey was a major destination among Chinese buyers.
Other major destinations were North Carolina, Arizona, Minnesota, Georgia, Illinois, and Virginia. Arizona had been one of the top five destinations in past years but was not in the top 5 list this year. It was a major destination among Canadian buyers.
Higher median purchase price among foreign buyers reflects location choices
The median existing-home sales price among foreign buyers was $314,600, 15% more than the median price of $274,600 of all existing-homes sold in the U.S. during the April 2019–March 2020. The price difference reflects the choice of location and type of properties desired by foreign buyers. Chinese buyers had the highest median purchase price, at $449,500, with nearly half of Chinese buyers purchasing property in California and New York.
Thirty-nine percent of foreign buyer transactions were all-cash sales, with a higher percentage among non-resident foreign buyers (59%) compared to resident foreign buyers (27%). Canadian buyers were the most likely to pay all-cash, at 66%, while Asian Indian buyers were the least likely, at 8%. Forty percent of Chinese buyers made an all-cash purchase.
Methodology
This survey was sent to 150,000 randomly selected REALTORS®. The online survey was conducted from May 21–June 24, 2020. A total of 11,615 REALTORS® responded to the 2020 survey, of which 1,190 reported an international residential foreign buyer. NAR also conducted separate studies for the Raleigh Regional Association of REALTORS®, Mainstreet Organization of REALTORS®, Austin Board of Realtors®, the Long Island Board of Realtors® and the Ohio Realtors®, and their responses were added to the national random sample. To correct for over/under-sampling across states, NAR weighted the distribution of responses to the distribution of NAR membership by state as of June 2020. Respondents provided information about the characteristics of international clients based on the most recent closed transactions from April 2019–March 2020. To minimize the response bias that can skew upwards the share of foreign buyers to existing home sales, NAR estimates the share of non-resident (Type A) foreign buyers to existing home sales from the monthly REALTORS® Confidence Index Survey that that gathers information on the characteristics of transactions of the respondent’s most recent sale for the reference month, which are viewed as a random sample of all transactions for the month.
The National Association of Realtors (NAR) is optimistic that the American Dream Down Payment Act will continue to gain momentum on Capitol Hill.
U.S. Rep. Cory Gardner, left, is sponsoring legislation with Sen. Doug Jones of Alabama to make it easier for people to save money to buy a home.
Legislation introduced by Senators Doug Jones (D-AL) and Cory Gardner (R-CO) is being recognized as a critical component of the national effort to address the barriers to first-time homeownership in America. The National Association of Realtors®, which previously submitted a letter in support of the legislation, expressed optimism that the American Dream Down Payment Act and other similar proposals to address housing affordability would continue gaining momentum on Capitol Hill.
“The resiliency of our residential real estate market has been one of the few bright spots of America’s economy during this pandemic, but numerous would-be homebuyers are finding it difficult or impossible to save the money needed for a down payment on a home,” said NAR President Vince Malta, broker at Malta & Co., Inc., in San Francisco, CA. “This is especially discouraging given record-low interest rates are making it easier for aspiring homeowners to afford monthly mortgage payments.
“Modeled on the very popular 529 education savings account concept, the American Dream Down Payment Act would allow savings for the down payment of a principal residence to grow tax-free, offering a responsible and commonsense approach to the multi-faceted problem of housing affordability in America.”
In its letter sent Monday to Senators Jones and Gardner, NAR relayed hope that these accounts could serve as a tangible resource to aspiring homeowners who have been unable to save sufficient funds for a down payment. According to the Urban Institute, two-thirds of renters have identified the inability to save for a down payment as an obstacle to homeownership.
“We appreciate your initiative in putting forth a reasonable proposal that should attract support from your colleagues as well as the growing population of those for whom down payment assistance would help open the door to their all-important first home purchase,” Malta wrote to the lawmakers.
As described by Senators Jones and Gardner, the American Dream Down Payment Act would:
Let states establish American Dream Down Payment Accounts, which they would manage in the same way they manage 529 Plan accounts;
Allow prospective homeowners to save as much as 20% of today’s home cost, indexed for inflation, to use for an eligible down payment and other housing costs;
Facilitate long-term savings for a down payment and allow contributions from family and friends; and
Allow homebuyers to use those savings and earnings tax-free at withdrawal for eligible expenses.
The National Association of Realtors® is America’s largest trade association, representing more than 1.4 million members involved in all aspects of the residential and commercial real estate industries.
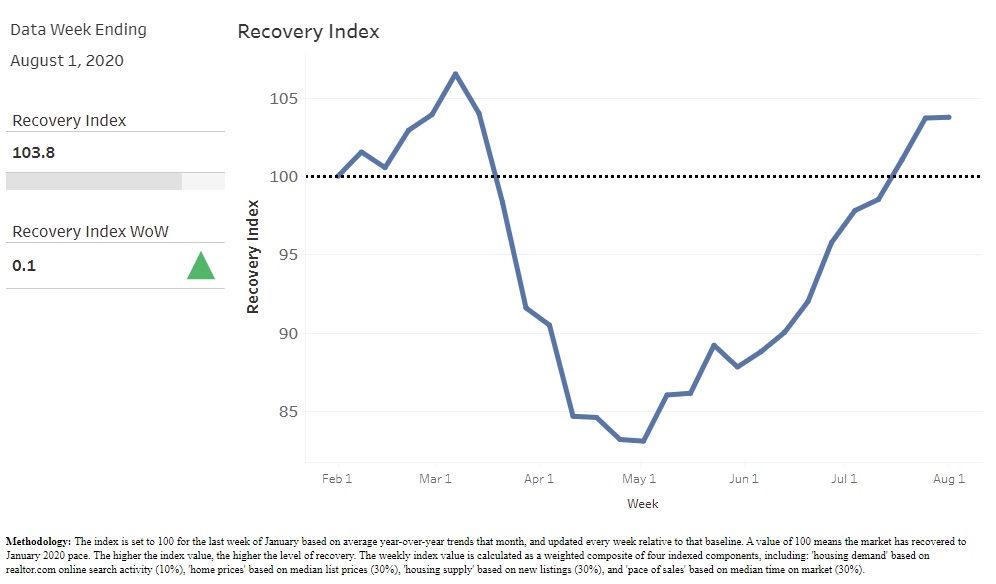
The U.S. real estate market is now doing better than it did before the pandemic, with the Recovery Index hitting 103.8 compared to a back-to-normal score of 100. Two Central Florida metros have fully recovered as South Florida and Jacksonville move closer.
Home buying season’s usual May peak has shifted to August as buyers and sellers rebound from spring’s COVID disruption, according to Realtor.com’s Weekly Recovery Report. This week’s data shows growth in pace of sales, demand and prices have surpassed last year levels, while inventory continues to lag seasonal normals.
Realtor.com’s Housing Market Recovery Index reached 103.8 nationwide for the week ending Aug. 1, posting a 0.1 point increase over last week and bringing the index 3.8 points above the pre-COVID baseline.
According to the weekly survey, the New York-Newark-Jersey City metro area has seen the strongest rebound. It ranked first with a recovery index of 129.6, a weekly increase of 9.6 points. The Wisconsin metro area of Milwaukee-Waukesha-West Allis ranked last as No. 50 with an index score of 89.2 – a weekly drop of 1.5 points.
In Florida, two cities rose about the old-normal score of 100 this week, while two other cities remained slightly below:
The Orlando-Kissimmee-Sanford metro area ranked No. 22 with a score of 102.5 – a weekly increase of 9.6
The Tampa-St. Petersburg-Clearwater metro area ranked No. 25 with a score of 102.2 – a weekly increase of 1.2
The Jacksonville area was No. 34 with a score of 99.3 – a 3.4 weekly increase
The Miami-Fort Lauderdale-West Palm Beach metro area ranked No. 41 with a score of 96.8, a 0.2 weekly increase
“Real estate activity in the U.S. has regained its strength and continues on an upward trajectory as we enter the middle of the summer,” says Javier Vivas, director of economic research for realtor.com.
Vivas says the unusually robust summer selling season is making up for weakness in the spring, but current patterns will have to last 10 more weeks to “make up for the lost activity in the second quarter of the year. As we head into fall, an anticipated resurgence in COVID cases and economic aftershocks are likely to create an uphill battle for home buyers and sellers.”
Time on market is now 4 days faster than last year – a result of too few homes for sale and mortgage rates at or near-record lows.
Median listing prices grew 9.4% year-to-year, and the rate of home price increases continues to pick up speed. The report calls the price rise “perhaps the most surprising aspect of how the housing market has fared – a dramatic departure from the last time unemployment was in double-digit territory.”
New listings dropped 11%, and a gradual improvement in the number of new sellers listing homes took a pause despite continued price gains.
Total inventory advertised on realtor.com declined 35%.
Regionally, the West (110.5) continues to lead the pack in the recovery, with the overall index now visibly above the pre-COVID benchmark. The Northeast (108.2) remains above recovery pace and continues to improve, while the South (99.5) and Midwest (98.8) continue to lag. A total of 29 markets have crossed the recovery benchmark.
The Weekly Housing Index leverages a weighted average of realtor.com search traffic, median list prices, new listings, and median time on market and compares it to the January 2020 market trend, as a baseline for pre-COVID market growth. The overall index is set to 100. The higher a market’s index value, the higher its recovery.


 The U.S. real estate market is now doing better than it did before the pandemic, with the Recovery Index hitting 103.8 compared to a back-to-normal score of 100. Two Central Florida metros have fully recovered as South Florida and Jacksonville move closer.